Visual summary
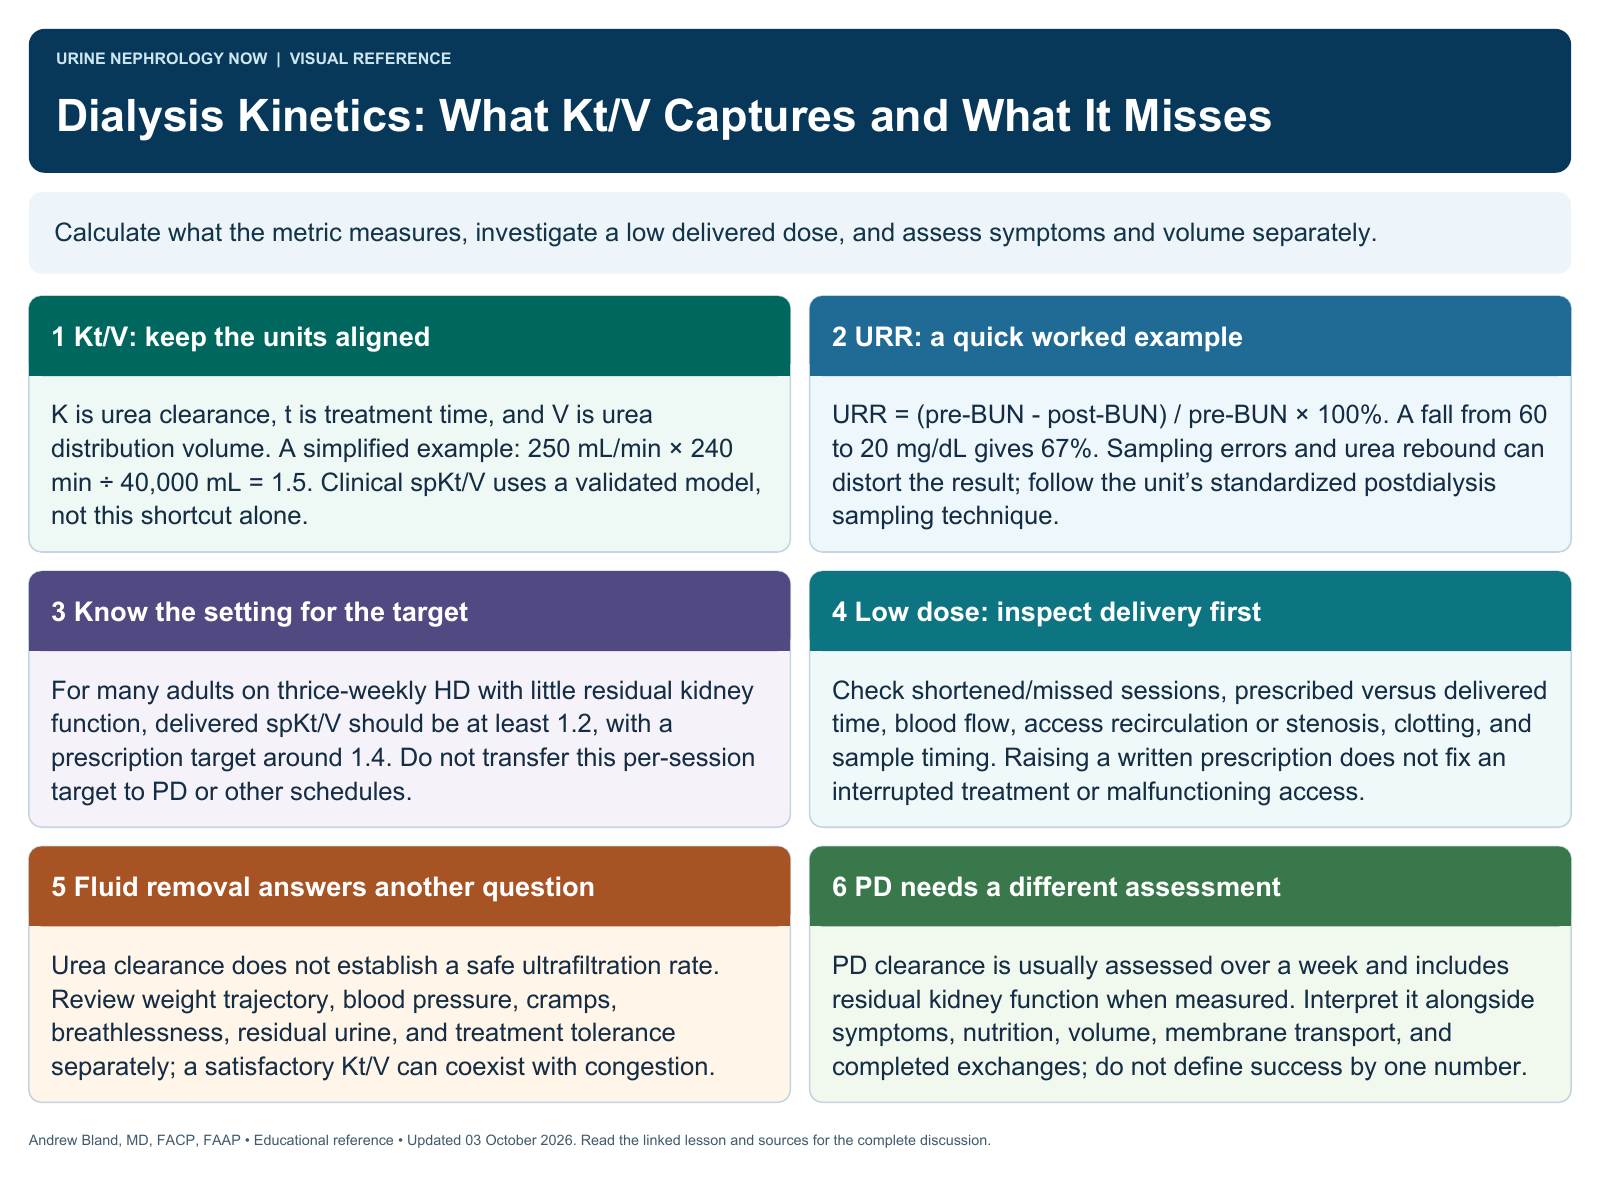
Calculate what the metric measures, investigate a low delivered dose, and assess symptoms and volume separately.
Text version
Kt/V: keep the units aligned
K is urea clearance, t is treatment time, and V is urea distribution volume. A simplified example: 250 mL/min × 240 min ÷ 40,000 mL = 1.5. Clinical spKt/V uses a validated model, not this shortcut alone.
URR: a quick worked example
URR = (pre-BUN − post-BUN) / pre-BUN × 100%. A fall from 60 to 20 mg/dL gives 67%. Sampling errors and urea rebound can distort the result; follow the unit’s standardized postdialysis sampling technique.
Know the setting for the target
For many adults on thrice-weekly HD with little residual kidney function, delivered spKt/V should be at least 1.2, with a prescription target around 1.4. Do not transfer this per-session target to PD or other schedules.
Low dose: inspect delivery first
Check shortened/missed sessions, prescribed versus delivered time, blood flow, access recirculation or stenosis, clotting, and sample timing. Raising a written prescription does not fix an interrupted treatment or malfunctioning access.
Fluid removal answers another question
Urea clearance does not establish a safe ultrafiltration rate. Review weight trajectory, blood pressure, cramps, breathlessness, residual urine, and treatment tolerance separately; a satisfactory Kt/V can coexist with congestion.
PD needs a different assessment
PD clearance is usually assessed over a week and includes residual kidney function when measured. Interpret it alongside symptoms, nutrition, volume, membrane transport, and completed exchanges; do not define success by one number.