Visual reference
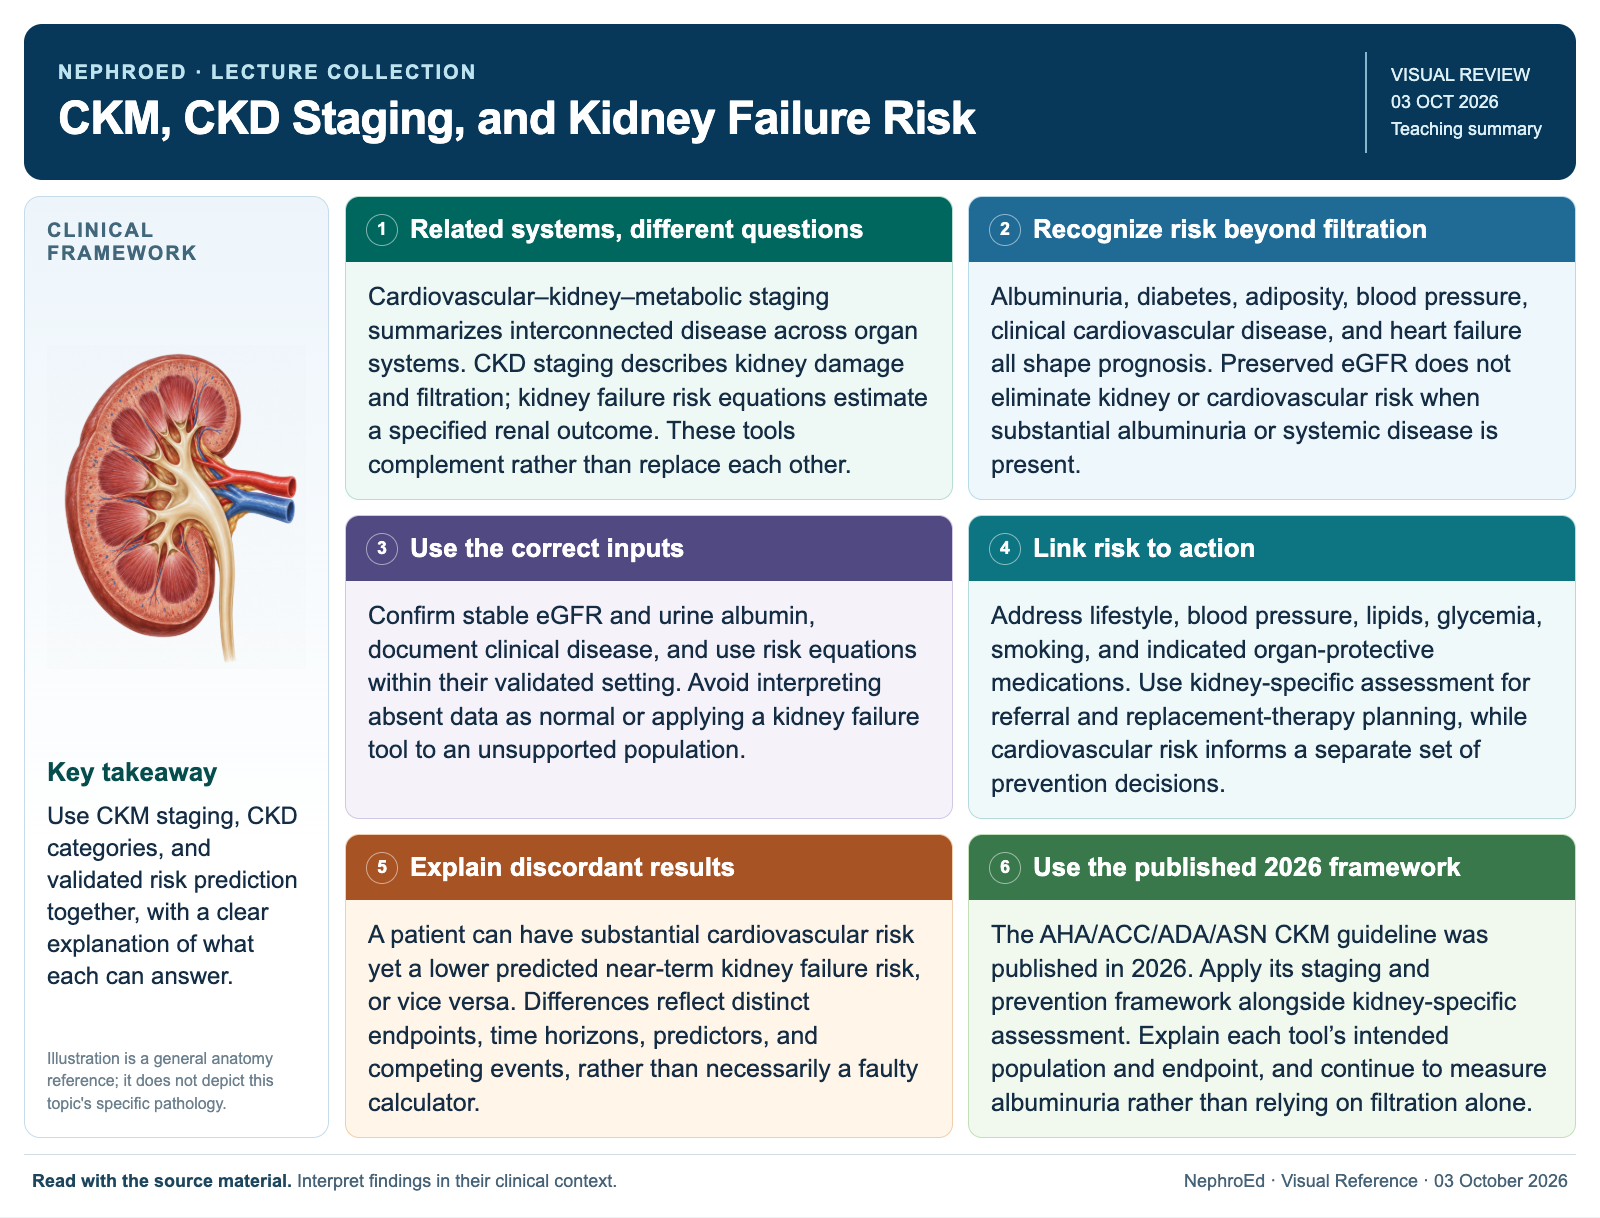
Browse the visual reference library · Download lesson Markdown
🧬 Part 1 — The CKM stages in detail
| Stage | Qualifying criteria |
|---|---|
| 1 | BMI at or above 25 kg/m² (or 23 if Asian ancestry), or waist circumference at or above 88 cm (women) / 102 cm (men) — or 80 / 90 cm if Asian ancestry — or fasting blood glucose 100–125 mg/dL or HbA1c 5.7–6.4%, without other metabolic risk factors or CKD |
| 2 | Metabolic risk factors — hypertriglyceridemia, hypertension, metabolic syndrome or type 2 diabetes — and/or moderate-to-high-risk CKD. Hypertriglyceridemia is defined by the guideline as fasting triglycerides at or above 150 mg/dL, or nonfasting at or above 175 mg/dL. |
| 3 | Subclinical ASCVD (elevated coronary calcium, or nonobstructive plaque on CTA); subclinical HF / pre-HF (elevated natriuretic peptide and/or hs-troponin, or echocardiographic abnormality); or a risk equivalent — very-high-risk CKD, or 10-year PREVENT-CVD at or above 20% |
| 4 | ASCVD: acute coronary syndrome, MI, stable or unstable angina, coronary or other arterial revascularization, stroke, TIA, peripheral artery disease. Heart failure: symptomatic HF at any ejection fraction. Atrial fibrillation — an independent qualifier needing no ischemic or structural disease. |
| Substage | Definition |
|---|---|
| 4a | Clinical CVD without kidney failure |
| 4b | Clinical CVD with kidney failure — eGFR below 15 mL/min/1.73 m², or chronic kidney replacement therapy |
🥬 Part 2 — The CKD stages (KDIGO)
KDIGO stages CKD on two independent axes, and this is the part most often collapsed to a single number in conversation. "Stage 3 CKD" names only the G axis and is an incomplete description of the patient.
G — glomerular filtration rate
- G1 — eGFR 90 or above
- G2 — 60 to 89
- G3a — 45 to 59
- G3b — 30 to 44
- G4 — 15 to 29
- G5 — below 15
A — albuminuria (UACR, mg/g)
- A1 — below 30 · normal to mildly increased
- A2 — 30 to 300 · moderately increased
- A3 — above 300 · severely increased
G1 and G2 are only CKD at all if something else is abnormal — albuminuria, structural disease, or another marker of damage. A normal-eGFR patient with A1 does not have CKD.
📏 Part 3 — Where CKD staging becomes CKM staging
CKM stage on the kidney axis is set by the G × A cell, not by G stage alone:
| eGFR | A1 — below 30 | A2 — 30 to 300 | A3 — above 300 |
|---|---|---|---|
| G1 — 90+ | No CKD → stage 0/1 | Stage 2 | Stage 2 |
| G2 — 60–89 | No CKD → stage 0/1 | Stage 2 | Stage 2 |
| G3a — 45–59 | Stage 2 | Stage 2 | Stage 3 |
| G3b — 30–44 | Stage 2 | Stage 3 | Stage 3 |
| G4 — 15–29 | Stage 3 | Stage 3 | Stage 3 |
| G5 — below 15 | Stage 3 | Stage 3 | Stage 3 |
🧪 Part 4 — Laboratory thresholds by stage
| Stage | eGFR | UACR | HF biomarkers | HbA1c |
|---|---|---|---|---|
| 1 | 60 or above, A1 (no CKD) | Not required | Not indicated | 5.7–6.4% — defines the stage |
| 2 | Per grid; measure with UACR annually | 30 mg/g or above qualifies | Test if PREVENT-HF at or above 5% | 6.5% or above — defines the stage |
| 3 | Very-high-risk CKD per grid | Value determines G3a/G3b assignment | Elevation defines pre-HF | Not a stage criterion |
| 4 | Full KDIGO staging | Same add-on thresholds | Diagnostic and prognostic, not staging | Not a stage criterion |
Pre-HF biomarkers — what the guideline actually specifies
Worth stating plainly, because secondary summaries often attach numbers here that the guideline does not publish: the 2026 guideline sets no numeric pre-HF biomarker cut points. Its criterion is qualitative — "elevations of cardiac biomarkers (BNP, NT-proBNP, or hs-cTn) or structural or functional abnormalities on cardiac imaging identify individuals with pre-HF who are at increased HF risk, with the co-occurrence of the 2 indicating greatest absolute HF risk."
The only numeric biomarker values anywhere in the document belong to individual studies, not to the recommendation: BNP at or above 50 pg/mL was the screening threshold in the STOP-HF trial, and NT-proBNP above 40 pg/mL was an entry criterion in a single 46-patient exercise study. Neither is a guideline cut point, and neither should be taught as one.
⚠️ Part 5 — Two structural weaknesses worth teaching
The framework is useful, but it buys its simplicity with two real compressions. Both matter most in nephrology, and both are worth saying out loud to students rather than letting them discover the hard way.
1. HbA1c is a switch, not a dial
CKM staging treats diabetes as binary. HbA1c of 6.5% assigns stage 2. HbA1c of 13% also assigns stage 2. Glycemic severity never escalates the stage — there is no mechanism in the staging system by which worse diabetes produces a worse stage.
Severity does re-enter, but only in two indirect places: agent selection — "severe hyperglycemia" is named among the comorbidities steering the choice of cardioprotective antihyperglycemic, and uncontrolled diabetes favors a GLP-1 RA over finerenone in the albuminuria add-on decision — and PREVENT, which takes HbA1c as a continuous input and will register the excess risk the stage label hides. If you stage without running PREVENT, that risk simply disappears from the assessment. This is worked through in the glycemic management deep dive.
2. Severe albuminuria with a preserved eGFR is under-staged
This one is sharper, and it cuts against the entire CKD literature. Look back at the grid: a patient at G1 or G2 with A3 — say eGFR 95 with a UACR of 1,200 mg/g — is CKM stage 2. That is the same stage as a patient whose only qualifying feature is uncomplicated hypertension, and the same stage as a G3a A1 patient with an eGFR of 50 and no albuminuria.
Set that against how KDIGO itself grades those cells. The KDIGO heat map has four risk bands, and the CKM grid collapses two of them:
| Cell | KDIGO risk band | CKM stage | Consequence |
|---|---|---|---|
| G3a A1 (eGFR 50, UACR 12) | Moderately increased | Stage 2 | — |
| G1–G2 A3 (eGFR 95, UACR 1,200) | High | Stage 2 | Higher KDIGO risk, identical CKM stage |
| G3a A3 | Very high | Stage 3 | Escalates only once eGFR has fallen too |
So why did a guideline endorsed by ASN do this?
The obvious suspicion — that nephrology was not in the room, or that KDIGO was not consulted — does not survive contact with the document. The guideline states verbatim that "the writing committee included representatives from the AHA, ACC, American Diabetes Association (ADA), including ADA Obesity Alliance representation, and the American Society of Nephrology." KDIGO is cited 39 times throughout, and the kidney axis is imported from the KDIGO heat map directly.
The published roster bears that out. Nephrology on the writing committee included Ian H. de Boer, David H. Ellison (FASN), Janani Rangaswami, Katherine R. Tuttle (FASN), and nephrology pharmacist Wendy St. Peter. And the KDIGO link is personal, not just bibliographic: de Boer and Tuttle are both KDIGO diabetes-and-CKD work-group principals — de Boer is first author on KDIGO's own consensus output on incretin therapies in CKD. The claim that no KDIGO figure sat on the panel is false.
The compression happens somewhere more interesting: at the translation step between KDIGO's risk bands and CKM's stages. KDIGO grades the G × A grid into four risk bands. The CKM framework imports them as two:
| KDIGO bands | Collapsed into | Effect |
|---|---|---|
| Moderately increased + high | CKM stage 2 | Two bands become one stage — G1–G2 A3 lands here |
| Very high | CKM stage 3 | Reserved for the top band only |
Read as a cardiovascular instrument, that collapse is defensible. A 35-year-old with an eGFR of 95 and a UACR of 1,200 genuinely does carry lower 10-year absolute cardiovascular risk than a 75-year-old at G4 — which is the quantity CKM staging exists to grade. The framework is not wrong about its own question. It is only wrong when borrowed to answer a kidney question it never claimed to answer.
And the guideline's answer to both critiques is the same: PREVENT
Neither limitation is stated as a limitation anywhere in the guideline. But both have the same structural resolution, and the text is explicit about the mechanism:
So both severities that the stage throws away — how heavy the albuminuria is, and how bad the diabetes is — re-enter as continuous inputs to the PREVENT add-on models. The stage is deliberately coarse; PREVENT is where the granularity lives. That is the framework's answer, and it is a coherent one.
🔗 Where to go next
🔍 Source and verification
Primary source: the 2026 AHA/ACC/ADA/ASN guideline for the prevention, detection, evaluation, and management of cardiovascular-kidney-metabolic syndrome (Circulation. 2026;154(4):e50–e158, PMID 42263157), published Free Access and read in full for these pages. Glycemic triggers are from the ADA Standards of Care in Diabetes — 2026, Section 9 (PMID 41358900), read in full via PubMed Central. Kidney staging and glycemic targets in CKD are from KDIGO 2024 and KDIGO 2022 (PMID 36272764), the latter verified against its peer-reviewed synopsis (PMID 36623286).
Every numeric threshold on this page was checked against the source text. Figures that could not be confirmed in a primary source were removed rather than published with a caveat — including a set of pre-HF biomarker cut points that circulate in secondary summaries but appear nowhere in the guideline.