Teach the opening foundations, then use the short lessons and figures to prepare learners for each case decision. The full teaching text and illustrations are collected here; the application questions remain linked to their original cases.
Find every infographic
The Day 1 mechanism figures and clinical guides appear with their teaching below. Select a title to go straight to the full image, zoom control, downloads, and lecture links.
Open the complete opening lecture and its illustrations
Start here · Before the first case
Why do we have kidneys? To keep the internal environment livable as the world around us changes. Begin with that job, then use blood work, urine, imaging, and the timeline to understand what has gone wrong.
01 · Begin with the purpose
Why have kidneys? Life out of water.
We live on land, but our cells still need a carefully controlled watery environment.
Kidneys help make life away from water possible: conserve water and salt when supplies are scarce, release excess when supplies are abundant, and remove wastes. They preserve the internal environment despite changing intake and losses.
A water-poor, salt-poor environment makes conservation essential. Modern salt excess challenges the same regulatory systems. Kidney disease becomes easier to understand when we ask which part of this balancing act has failed.
Start the discussion: If you could no longer adjust what leaves in the urine, what would happen after a day without water? After a salty meal?
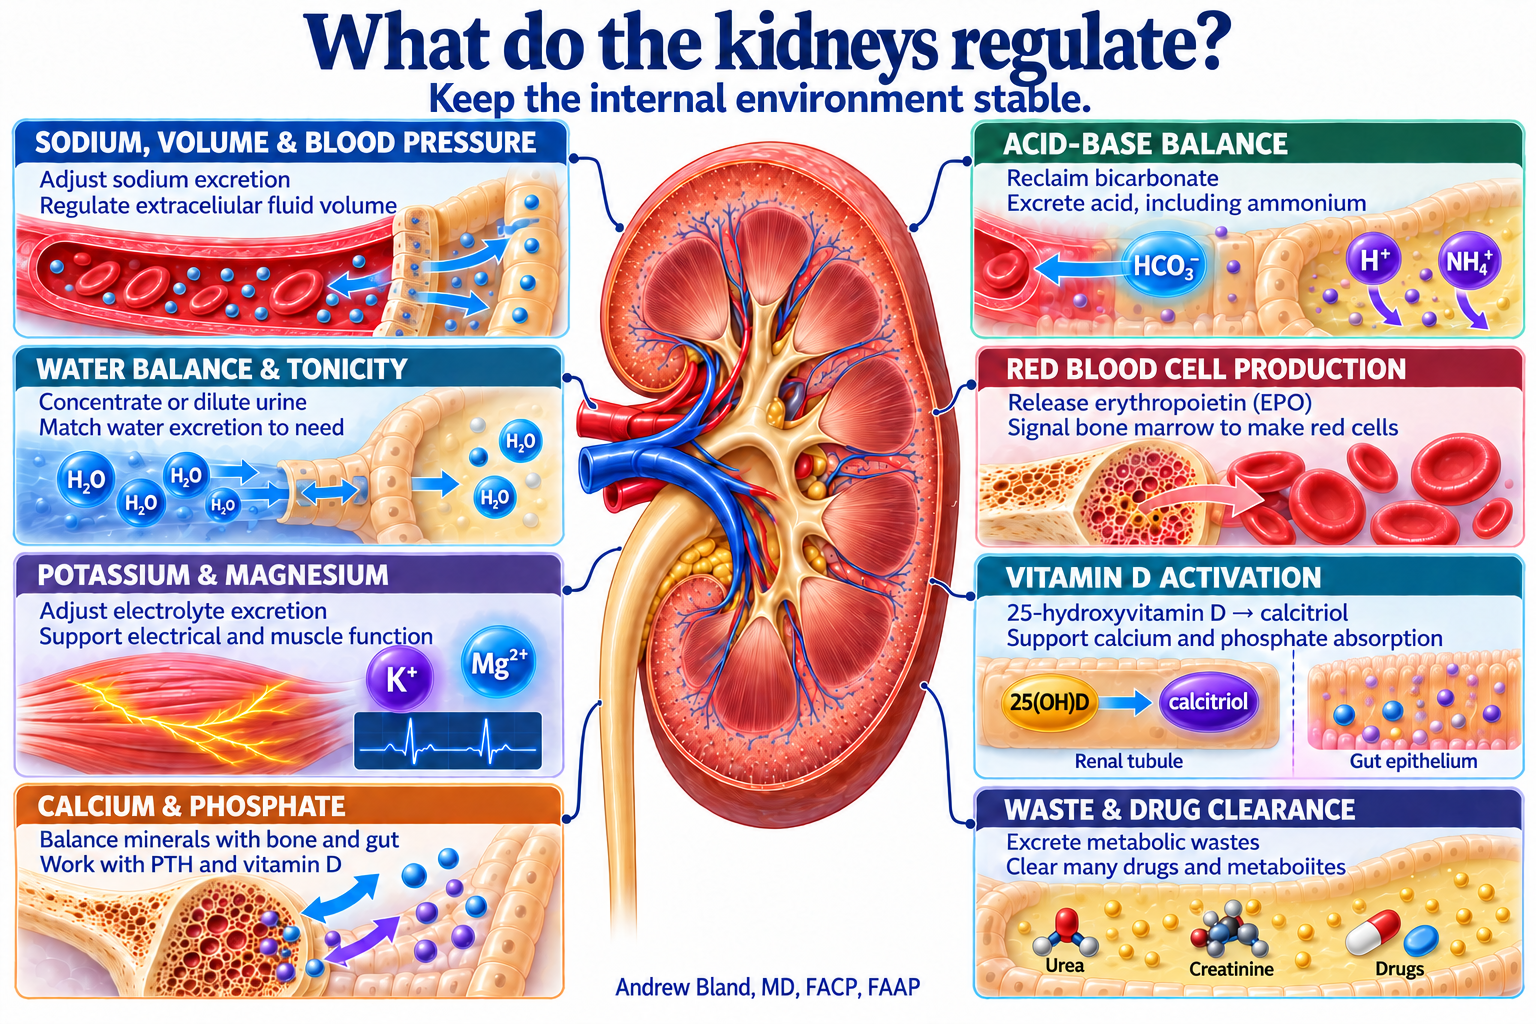
Total-body sodium helps determine extracellular fluid volume. The kidneys adjust sodium excretion and use hormonal signals to help control circulation and blood pressure. Serum sodium concentration alone is not a measure of volume status.
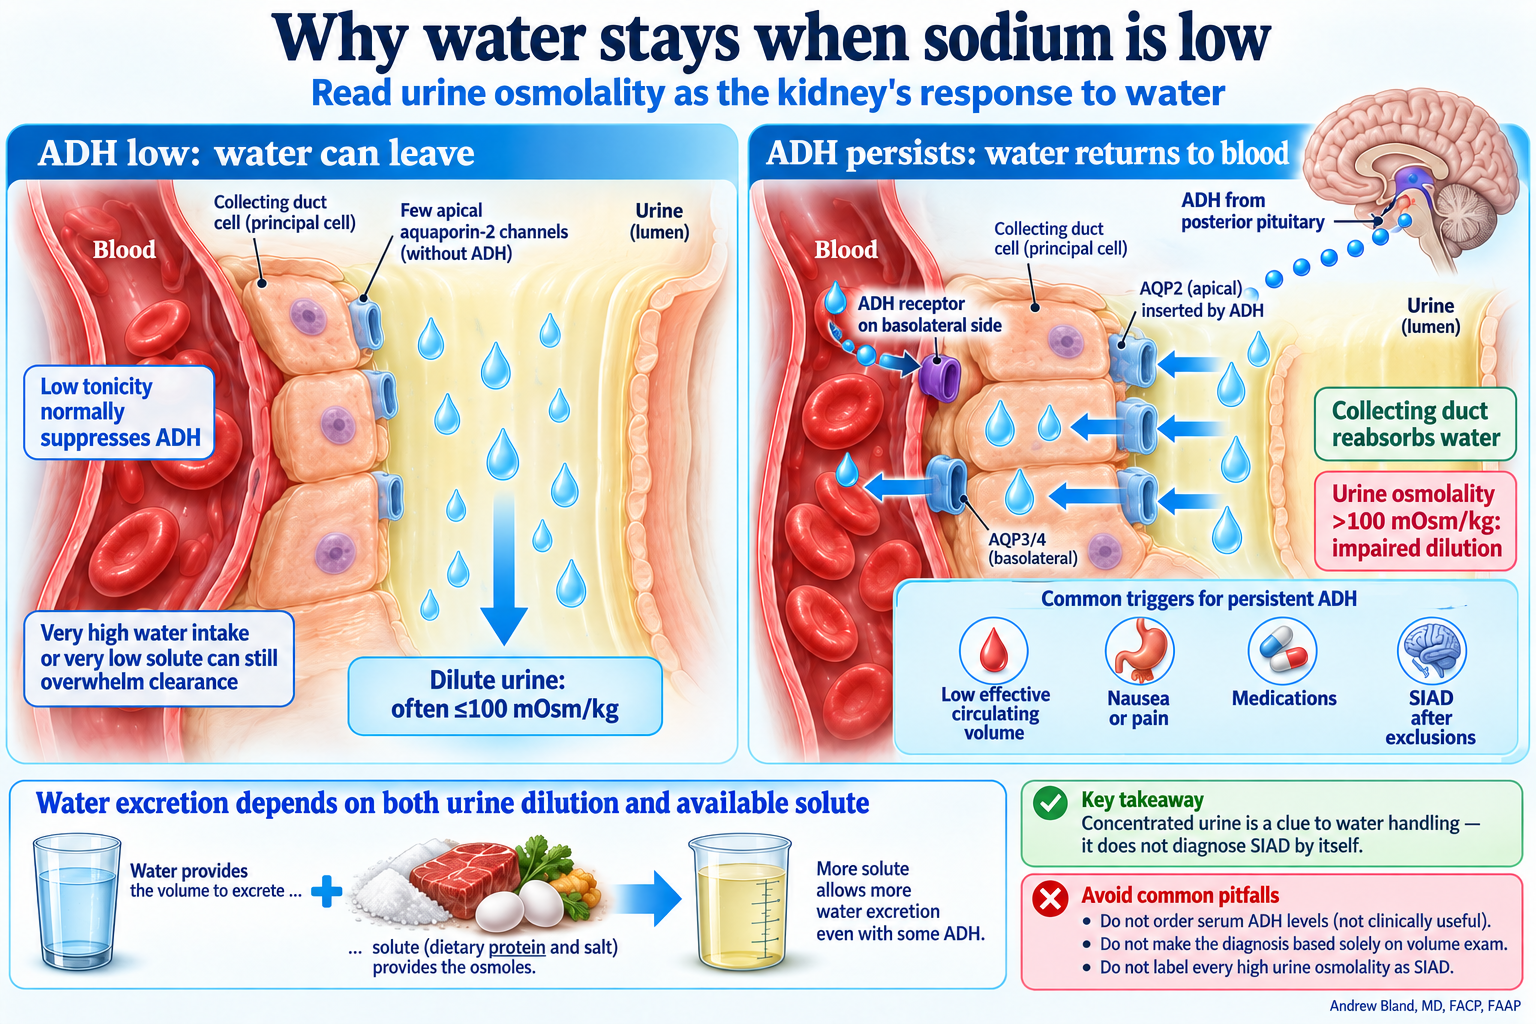
Concentrate or dilute urine to match water excretion to the body’s needs. ADH adjusts collecting-duct water permeability. Serum sodium concentration mainly reflects water relative to exchangeable sodium and potassium; urine osmolality helps show the kidney’s response.
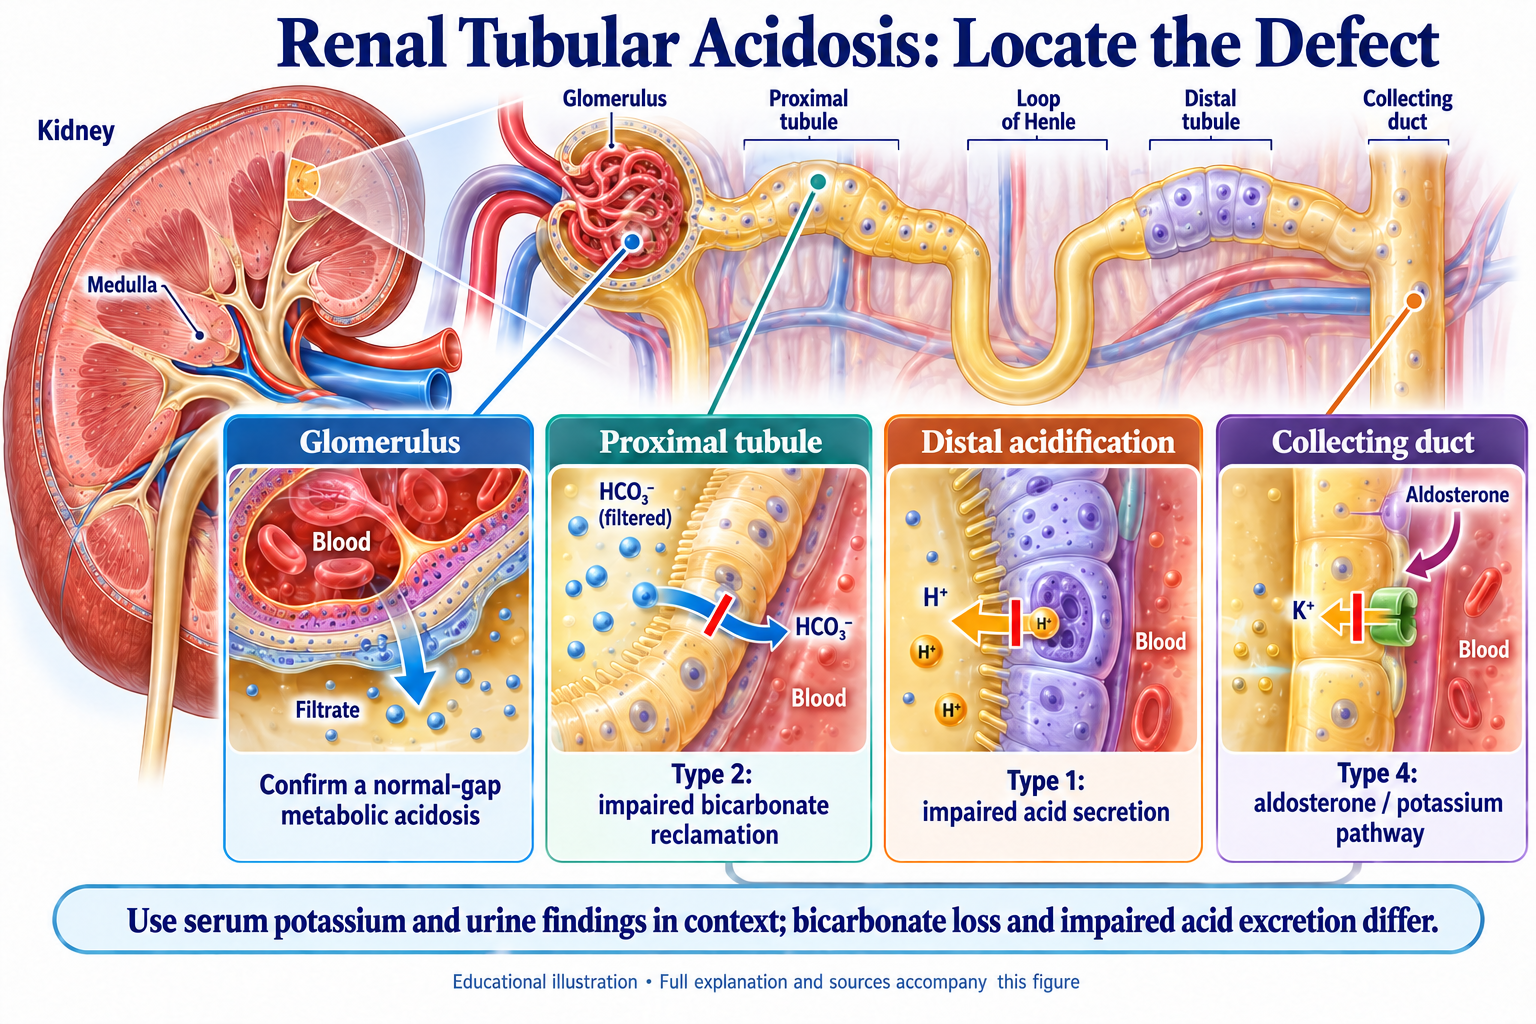
Reclaim filtered bicarbonate and excrete acid, including ammonium. Kidney dysfunction can change acid–base balance even before a dramatic creatinine rise.
Convert 25-hydroxyvitamin D to active calcitriol in the proximal tubule. This connects kidney function with calcium absorption, bone health, and parathyroid signaling.
Excrete metabolic wastes such as urea and creatinine, and eliminate many drugs and their metabolites through filtration and tubular handling. Reduced clearance can cause accumulation and change medication dosing. Urine volume alone does not tell us how effectively these solutes are cleared.
Read the blood work as a report card: Which of these jobs is disturbed? A “kidney problem” may present as water or electrolyte imbalance, acid–base disease, blood pressure changes, anemia, mineral disease, or impaired waste and medication clearance.
Recognize danger, begin monitored care and keep investigating in parallel.
Identify the immediate threat before completing the full diagnostic pathway. The detailed case guides add treatment timing, monitoring and cause-directed decisions.
Urgent-care teaching text and evidence
Treat danger while establishing the cause
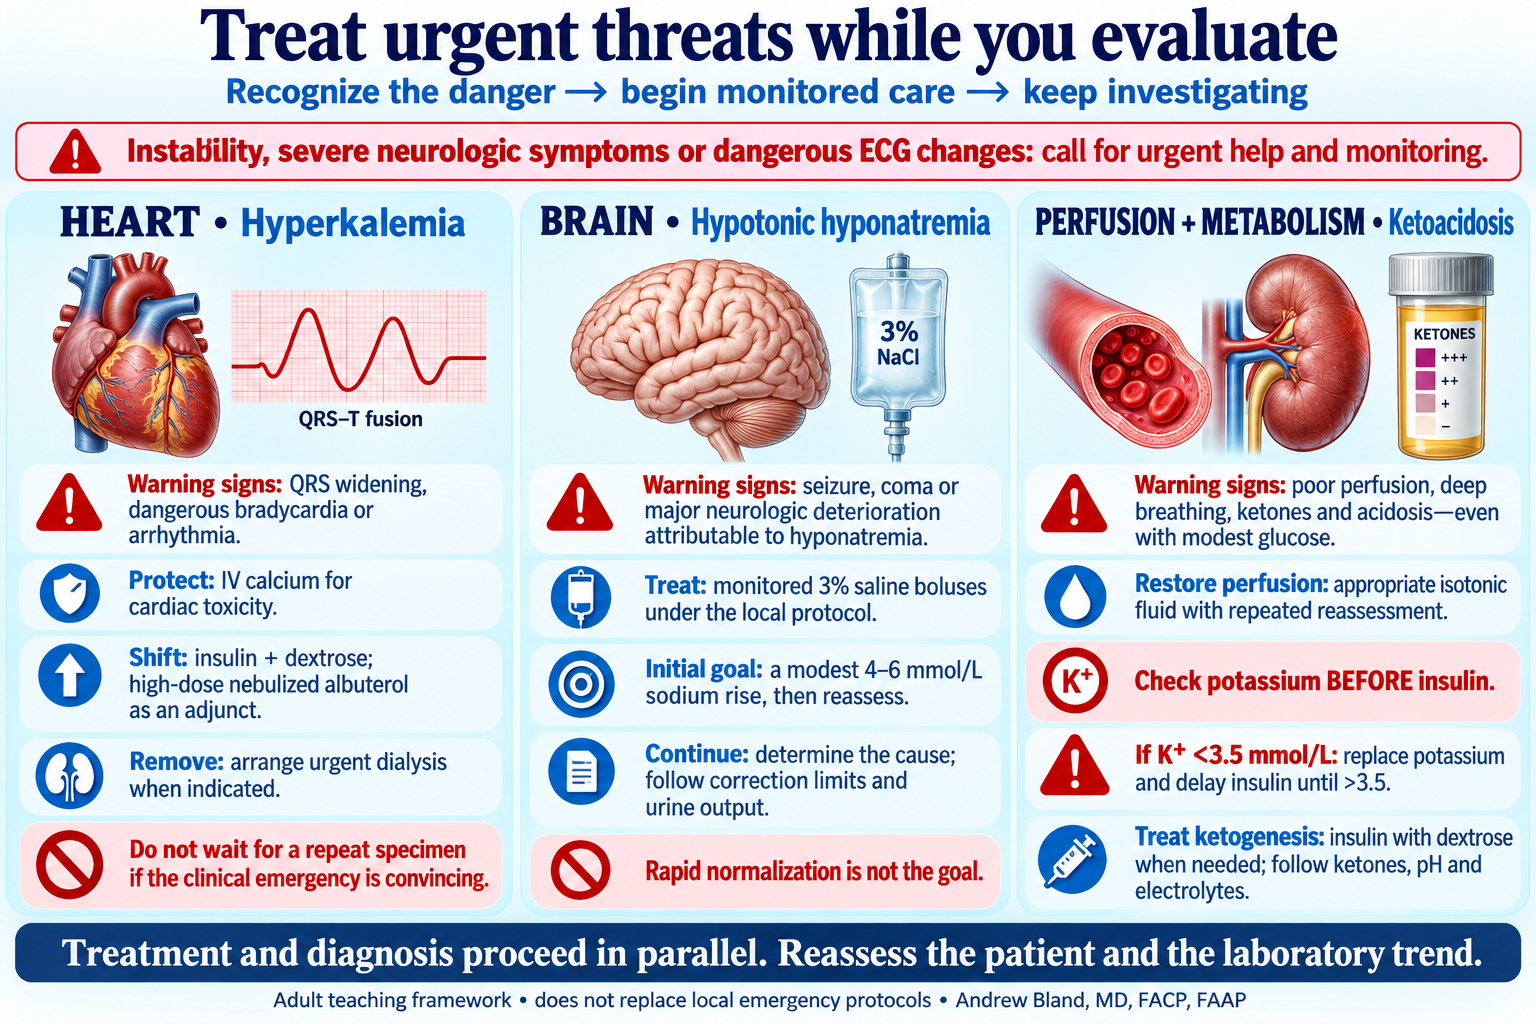
Clinical instability, dangerous ECG changes or severe neurologic symptoms call for urgent help and monitored care. Obtain focused tests without delaying treatment of a convincing emergency. Diagnostic reasoning continues alongside stabilization; a single improved number does not establish sustained safety.
Heart: hyperkalemia with cardiac toxicity
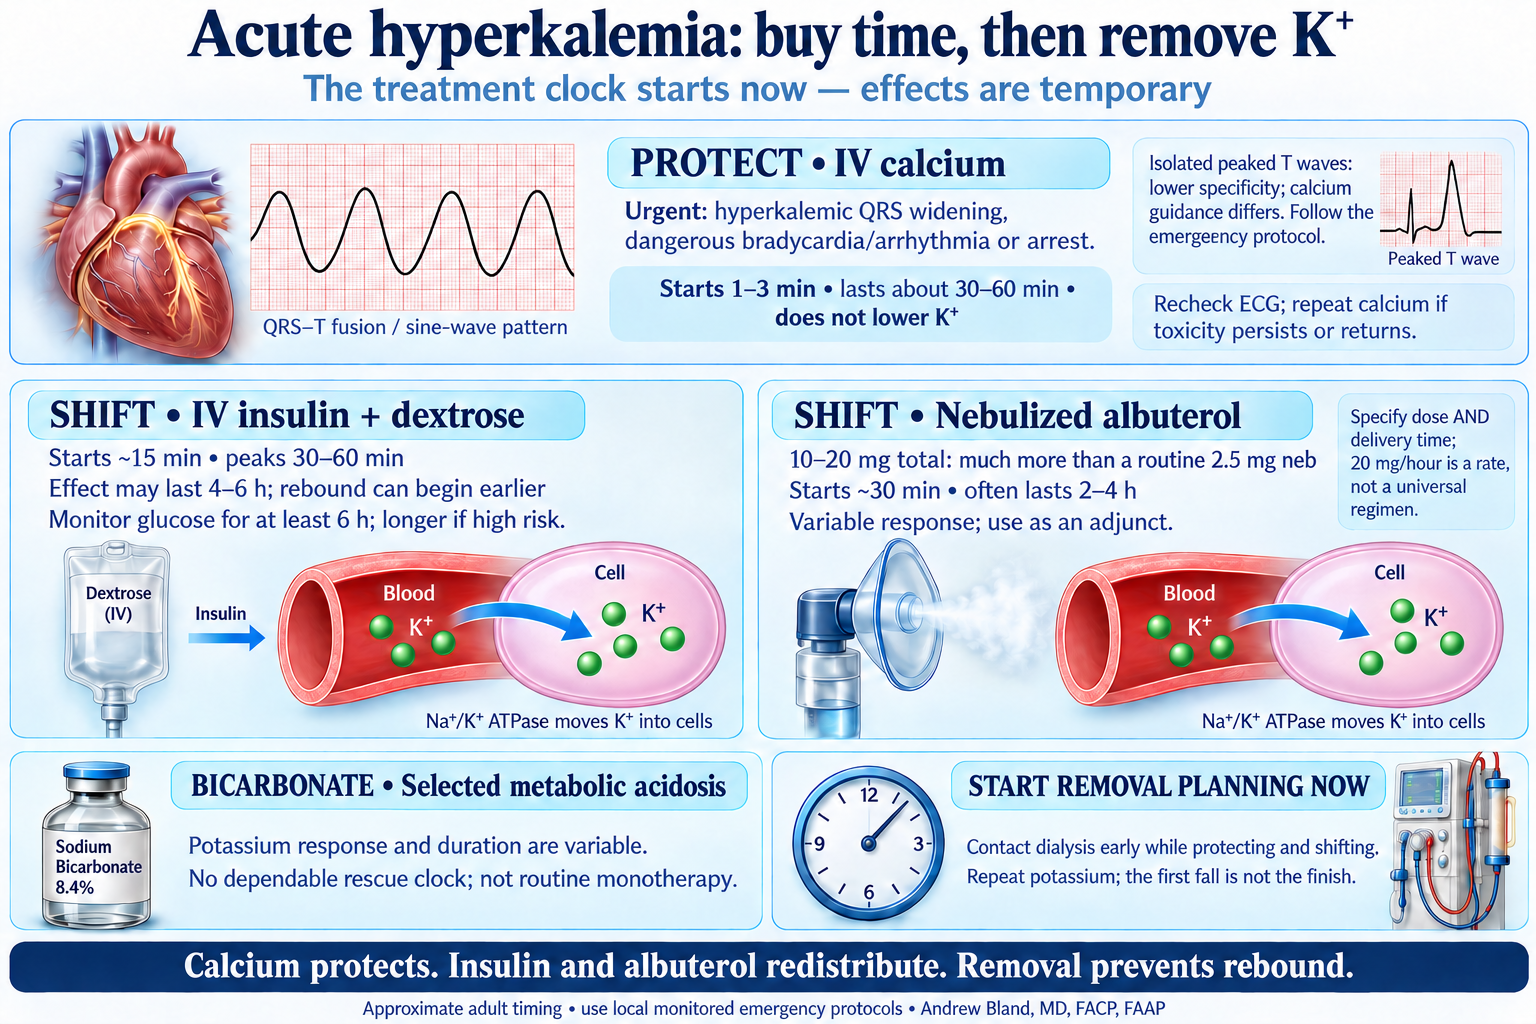
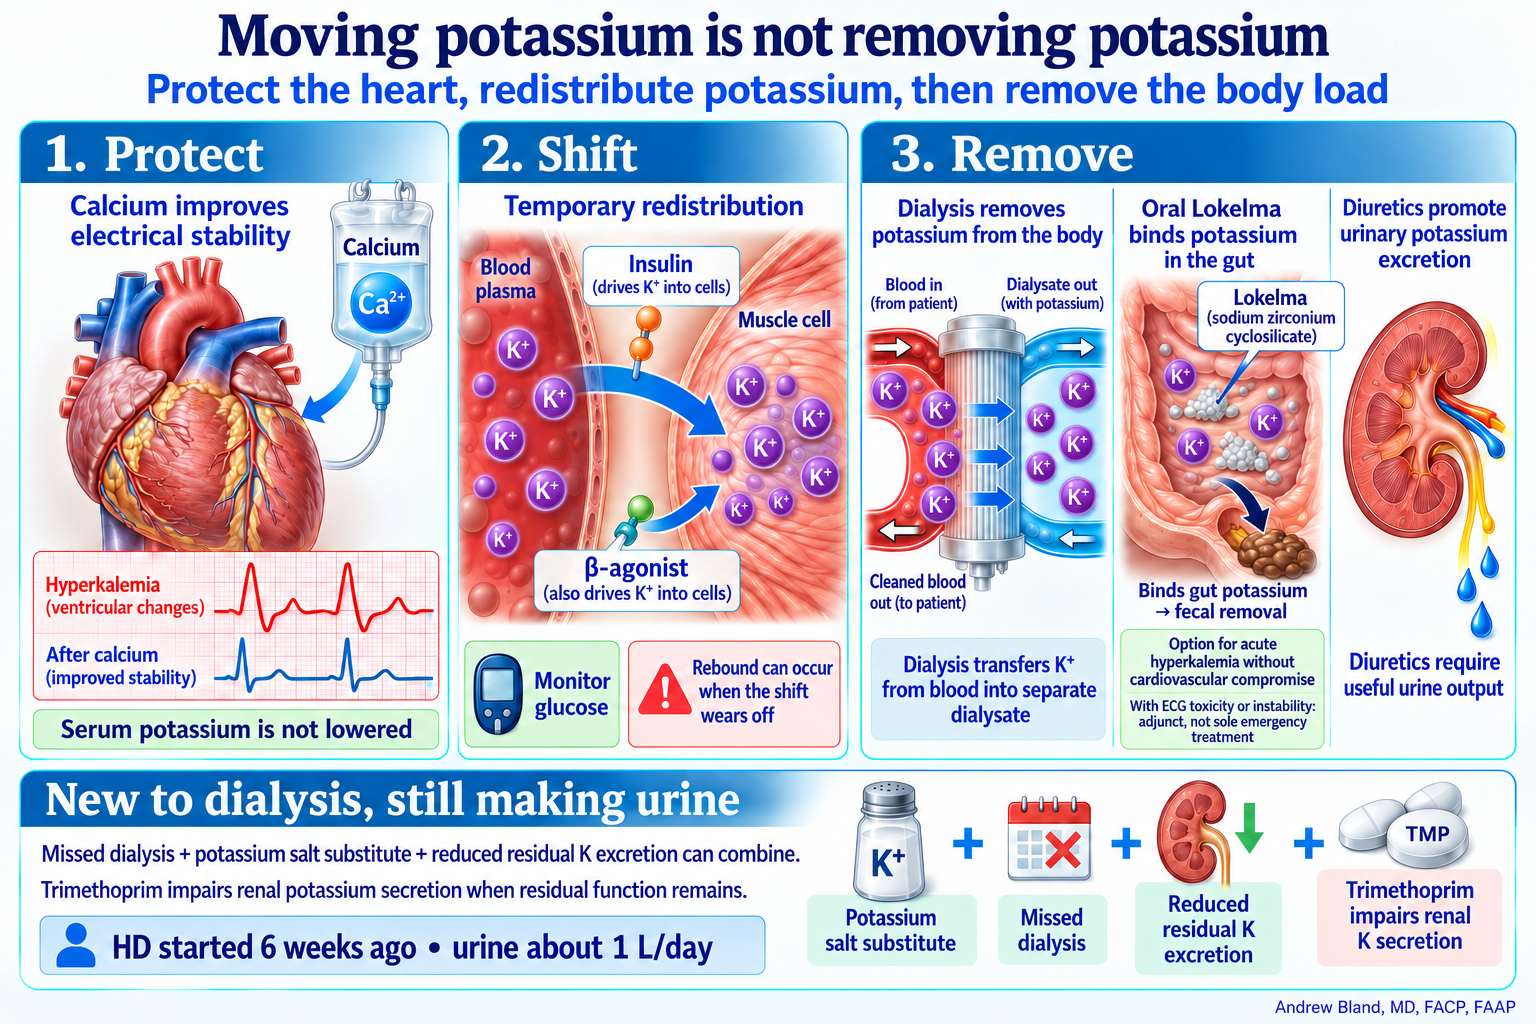
Prioritize hyperkalemic QRS widening, dangerous bradycardia or arrhythmia. Give IV calcium when indicated, shift potassium with insulin plus glucose support and adjunctive high-dose nebulized albuterol, and arrange effective removal. Follow ECG, potassium and glucose; calcium and shifting effects are temporary. The separate treatment-clock figure explains the isolated-peaked-T-wave nuance and treatment duration.
Brain: symptoms attributable to hypotonic hyponatremia
Seizure, coma or major neurologic deterioration attributable to hyponatremia warrants monitored 3% saline according to the local protocol. Aim initially for a modest effective rise of about 4–6 mmol/L, then reassess. Track urine output and correction limits while determining the cause. This urgent lane is driven by attributable symptoms, not by the sodium number alone.
Perfusion and metabolism: possible ketoacidosis
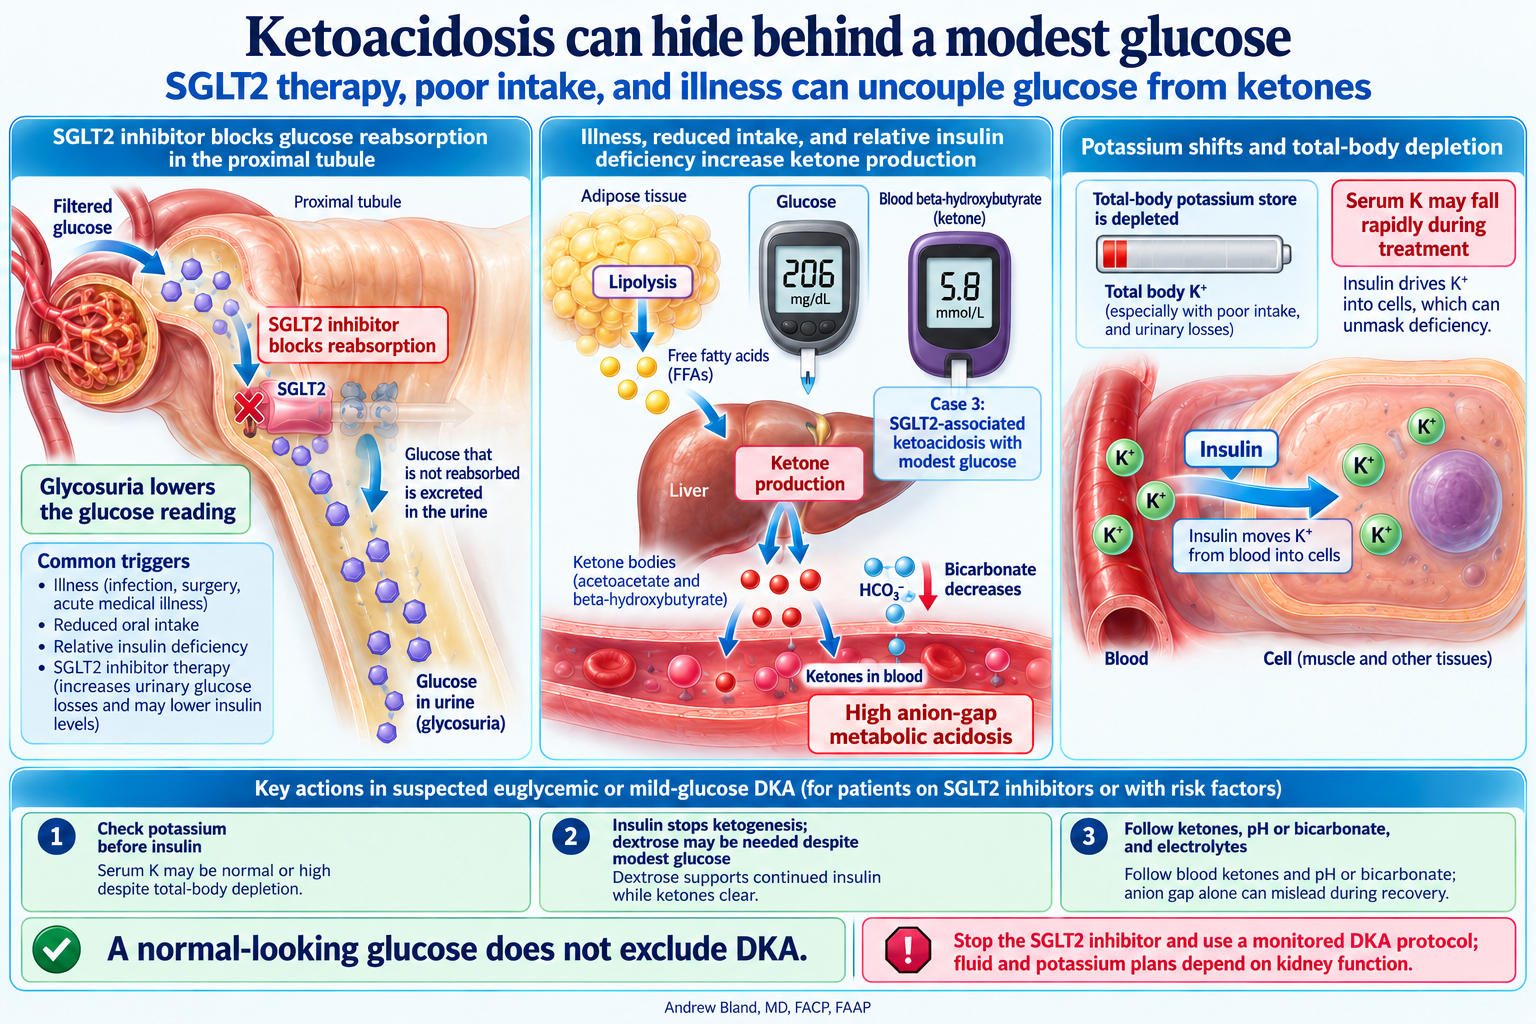
Poor perfusion, deep breathing and acidosis require urgent assessment; modest glucose does not exclude SGLT2-associated ketoacidosis. Restore circulation with an appropriate isotonic fluid and repeated reassessment. Measure potassium before insulin; if potassium is below 3.5 mmol/L, replace it and delay insulin until it exceeds 3.5. Use insulin with dextrose when needed to clear ketones. Prefer blood beta-hydroxybutyrate for assessing ketone burden and treatment response; follow pH, electrolytes and clinical status. A urine ketone dipstick can underestimate early disease.
Use the framework at every stage
Before the case, identify which findings would change the pace of care. As findings emerge, name the immediate threat, start indicated treatment and say what you will recheck. Use the later diagnosis-specific figures for doses, treatment clocks, correction limits and removal planning. Do not wait until the end of the workup to ask whether the patient needs urgent treatment.
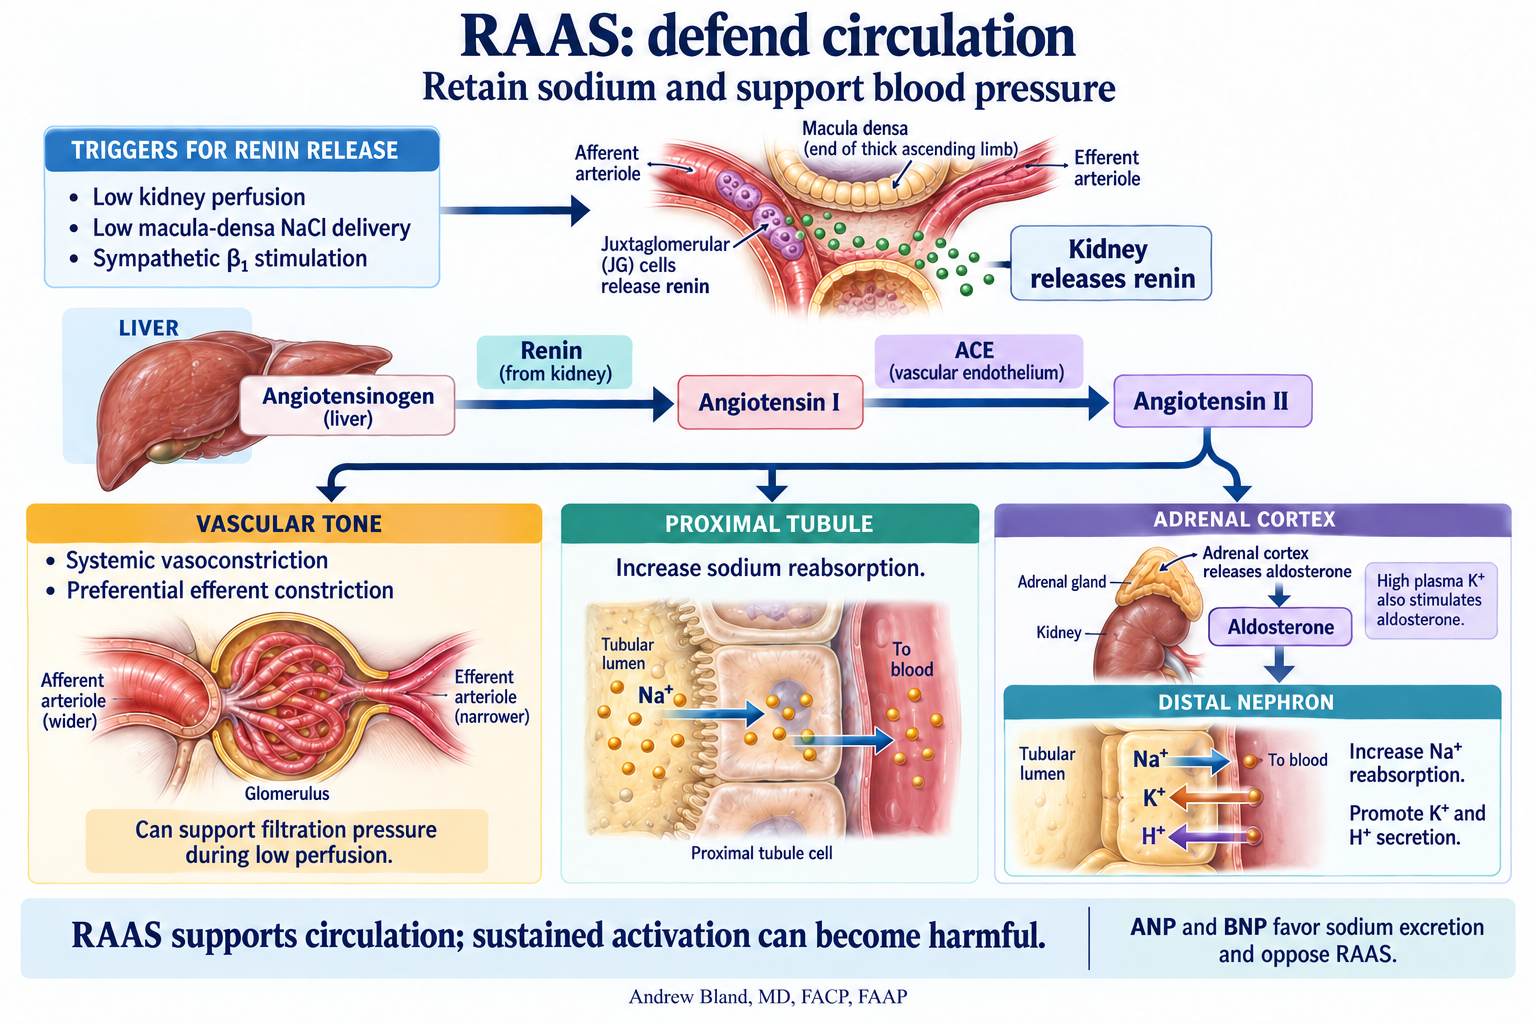
The renin–angiotensin–aldosterone system responds to signals such as reduced kidney perfusion, reduced macula-densa salt delivery, and sympathetic stimulation.
Kidney renin initiates the pathway; angiotensin II supports vascular tone and sodium retention. Adrenal aldosterone promotes distal sodium reabsorption and potassium and hydrogen-ion secretion.
ADH · conserve water
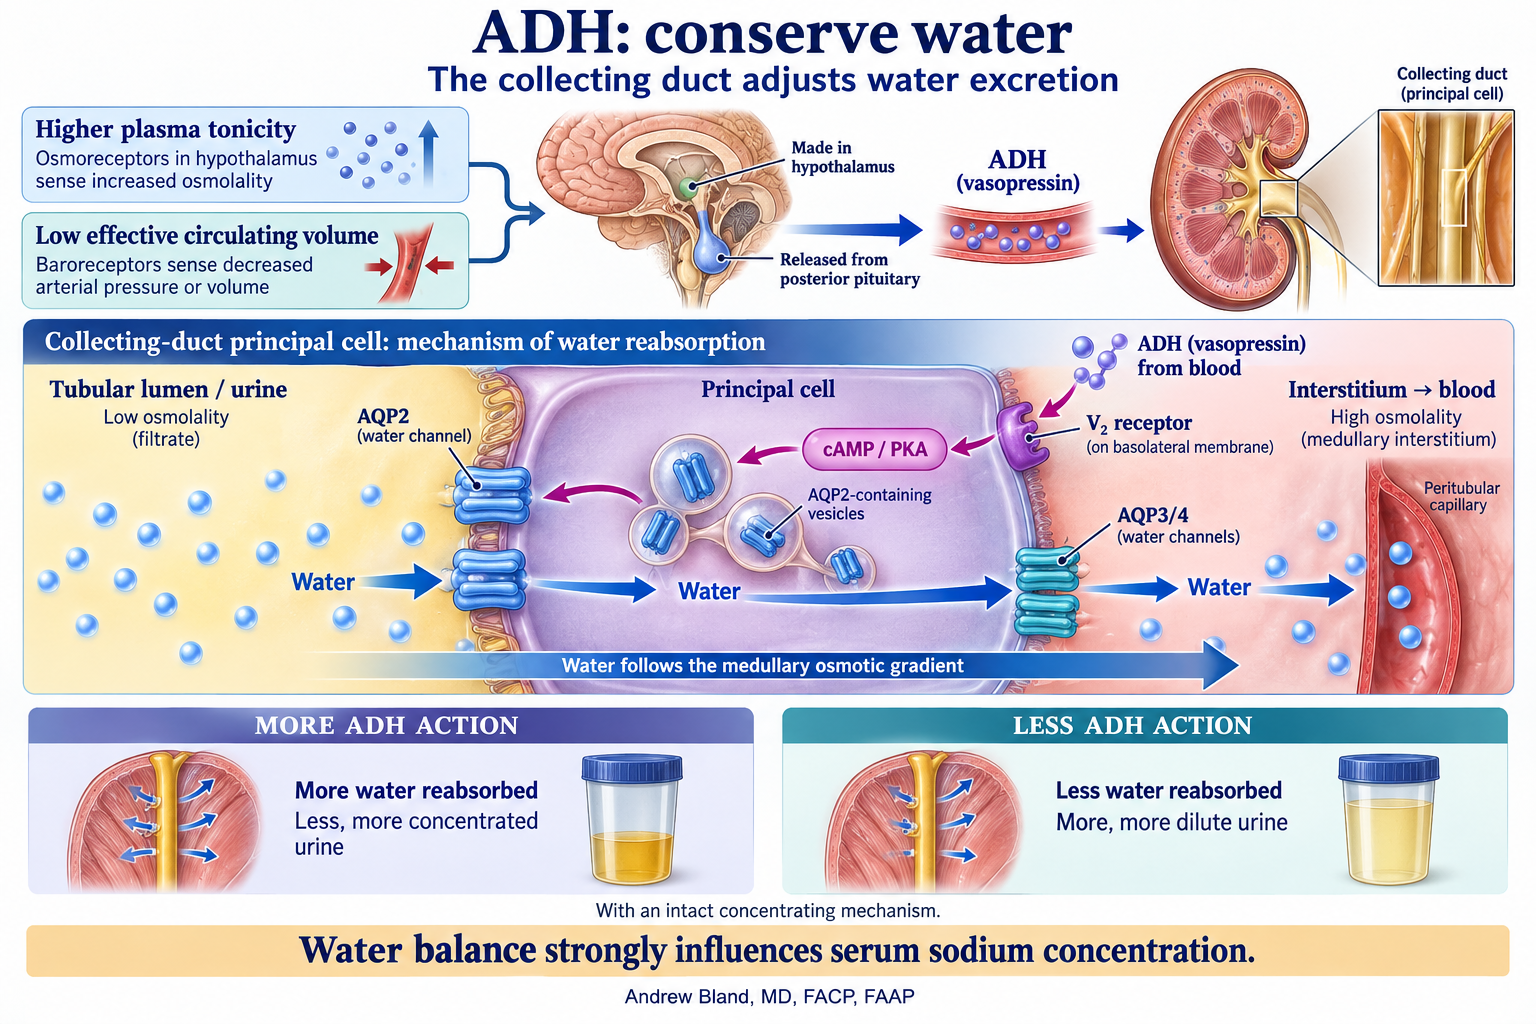
Antidiuretic hormone (vasopressin) is made in the hypothalamus and released from the posterior pituitary. Increased tonicity and reduced effective circulating volume stimulate its release.
ADH increases collecting-duct water permeability through aquaporin-2. This helps explain why a circulation problem can also become a serum sodium problem.
RAAS: from a circulation signal to sodium retention
Trigger and cascade: reduced renal perfusion, reduced macula-densa NaCl delivery, and sympathetic β₁ stimulation promote renin release from juxtaglomerular cells. Renin cleaves liver-derived angiotensinogen to angiotensin I; endothelial ACE forms angiotensin II.
Angiotensin II: supports systemic vascular tone and proximal sodium reabsorption. Preferential efferent constriction can help preserve glomerular pressure during reduced perfusion, but severe hypoperfusion still lowers GFR. Sustained activation can contribute to hypertension and kidney injury.
Aldosterone: comes from the adrenal cortex and promotes distal sodium reabsorption, potassium secretion, and acid secretion. High plasma potassium also directly stimulates its release.
Connect to the laboratory pattern: Why can aldosterone excess combine hypertension, low potassium, and metabolic alkalosis? What changes when an ACE inhibitor or ARB reduces angiotensin II signaling?
ADH: from a water signal to a collecting-duct response
ADH changes water permeability; the medullary osmotic gradient drives water reabsorption. Select the diagram to enlarge it. · Visual library: diagram and teaching text
Trigger and source: increased plasma tonicity stimulates ADH. Low effective circulating volume is another powerful stimulus, even when plasma sodium is low. ADH is made in the hypothalamus and released from the posterior pituitary.
Receptor and channel: ADH binds the basolateral V₂ receptor on collecting-duct principal cells. cAMP/PKA signaling moves AQP2 water channels into the apical, urine-facing membrane. Water exits the cell through basolateral AQP3/4 channels.
Response: with an intact concentrating mechanism, more ADH action means more water reabsorption, less urine volume, and more concentrated urine. Reduced ADH action permits greater excretion of dilute urine. Serum sodium depends on water balance relative to body solute, not simply on how much sodium was eaten.
Connect to the cases: A patient with heart failure can have edema, low effective arterial circulation, persistent ADH release, and hyponatremia at the same time. Which finding describes total-body fluid, and which describes tonicity?
Compare the two systems: RAAS helps defend sodium balance and circulation. ADH controls the collecting duct’s water permeability. They can activate together, but their effects are different.
Other signals that connect the organs
Signal
Where it comes from
Kidney connection
Erythropoietin · EPO
Predominantly kidney interstitial cells, responding to hypoxia.
Stimulates marrow red-cell production. Epogen is a brand of epoetin alfa, a medication that replaces the hormone’s action.
Active vitamin D · calcitriol
Activated in kidney proximal tubules.
Promotes intestinal calcium and phosphate absorption and participates in feedback with PTH.
Natriuretic peptides · ANP and BNP
Heart muscle, responding to stretch.
Favor sodium excretion and counter RAAS-mediated sodium retention. Their effects can be blunted in heart failure, so high peptide levels can coexist with congestion.
Parathyroid hormone · PTH
Parathyroid glands.
Acts on the kidney to conserve calcium, increase phosphate excretion, and stimulate calcitriol production. CKD can disrupt this feedback and raise PTH.
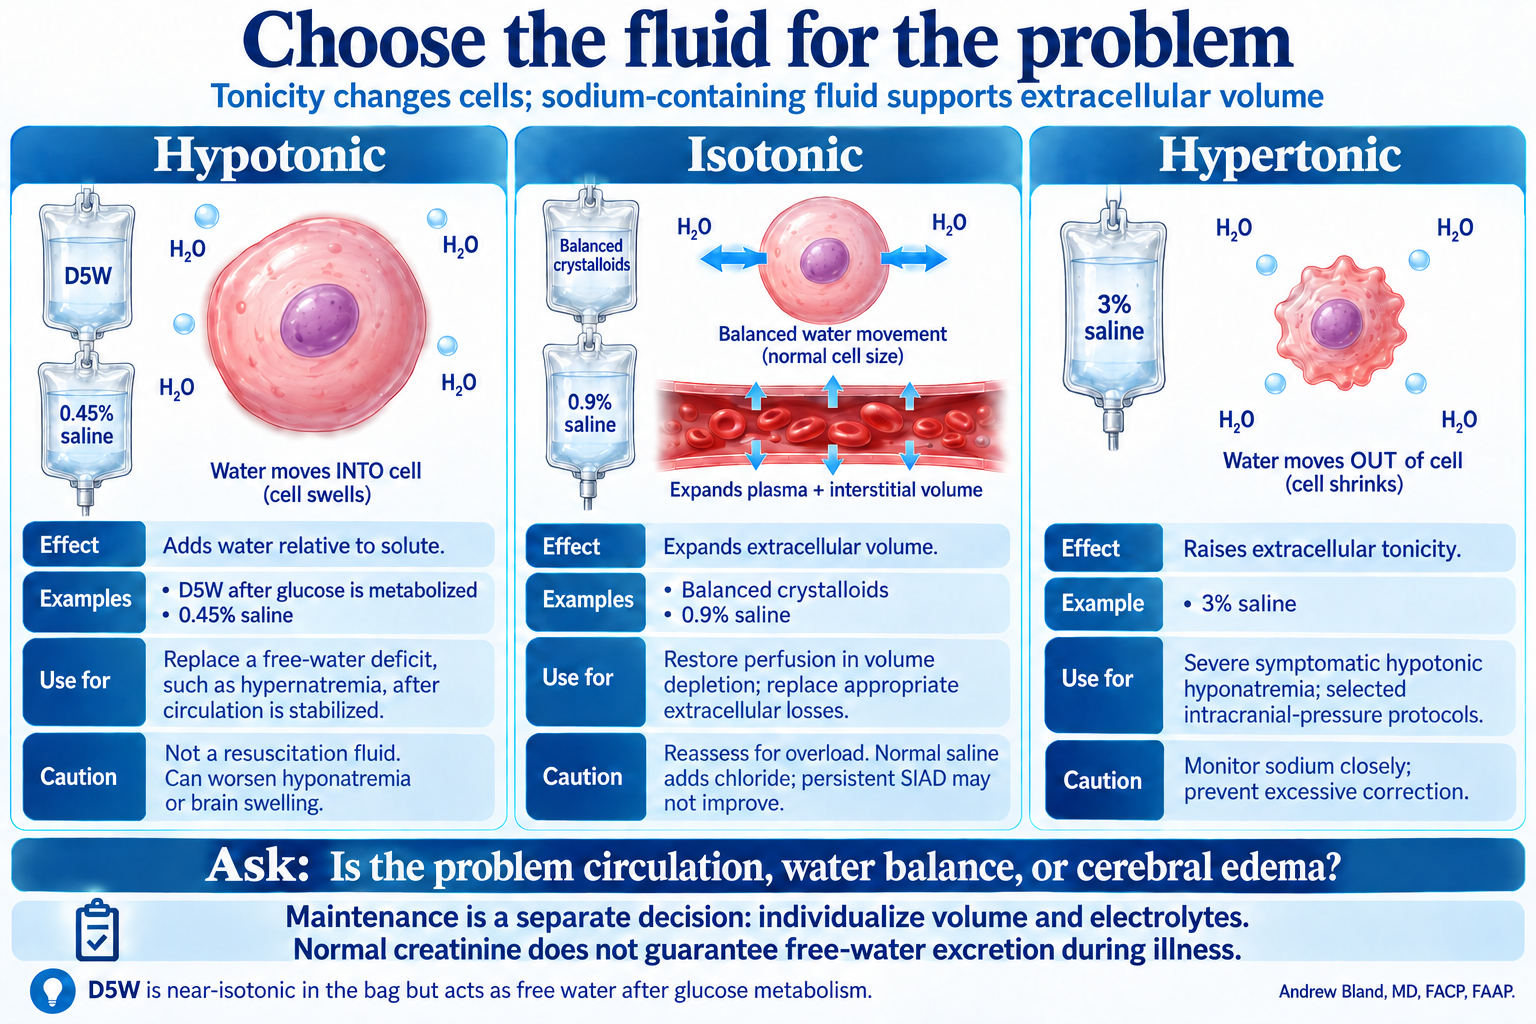
Separate circulation, water balance and cerebral edema from routine maintenance.
Hypotonic: replace water relative to solute
D5W becomes electrolyte-free water after glucose metabolism; 0.45% saline supplies both sodium and a free-water component. These can replace an identified water deficit, including hypernatremia, once circulation is stabilized. They are not resuscitation fluids and can worsen hyponatremia or brain swelling when water excretion is limited.
Isotonic: support extracellular volume
Balanced crystalloids such as LR and 0.9% saline are commonly used to restore perfusion in volume depletion. They distribute through extracellular fluid, including interstitial fluid; they do not remain entirely intravascular. Reassess perfusion, lungs, urine output and cumulative balance. In persistent SIAD, 0.9% saline may fail to improve sodium or sometimes worsen it.
Hypertonic: raise tonicity for a defined indication
3% saline is used for severe symptomatic hypotonic hyponatremia and selected intracranial-pressure protocols. Its use requires a defined goal and close monitoring. The initial objective in symptomatic hyponatremia is a modest effective rise, followed by reassessment and adherence to correction limits.
Compare bag pH carefully
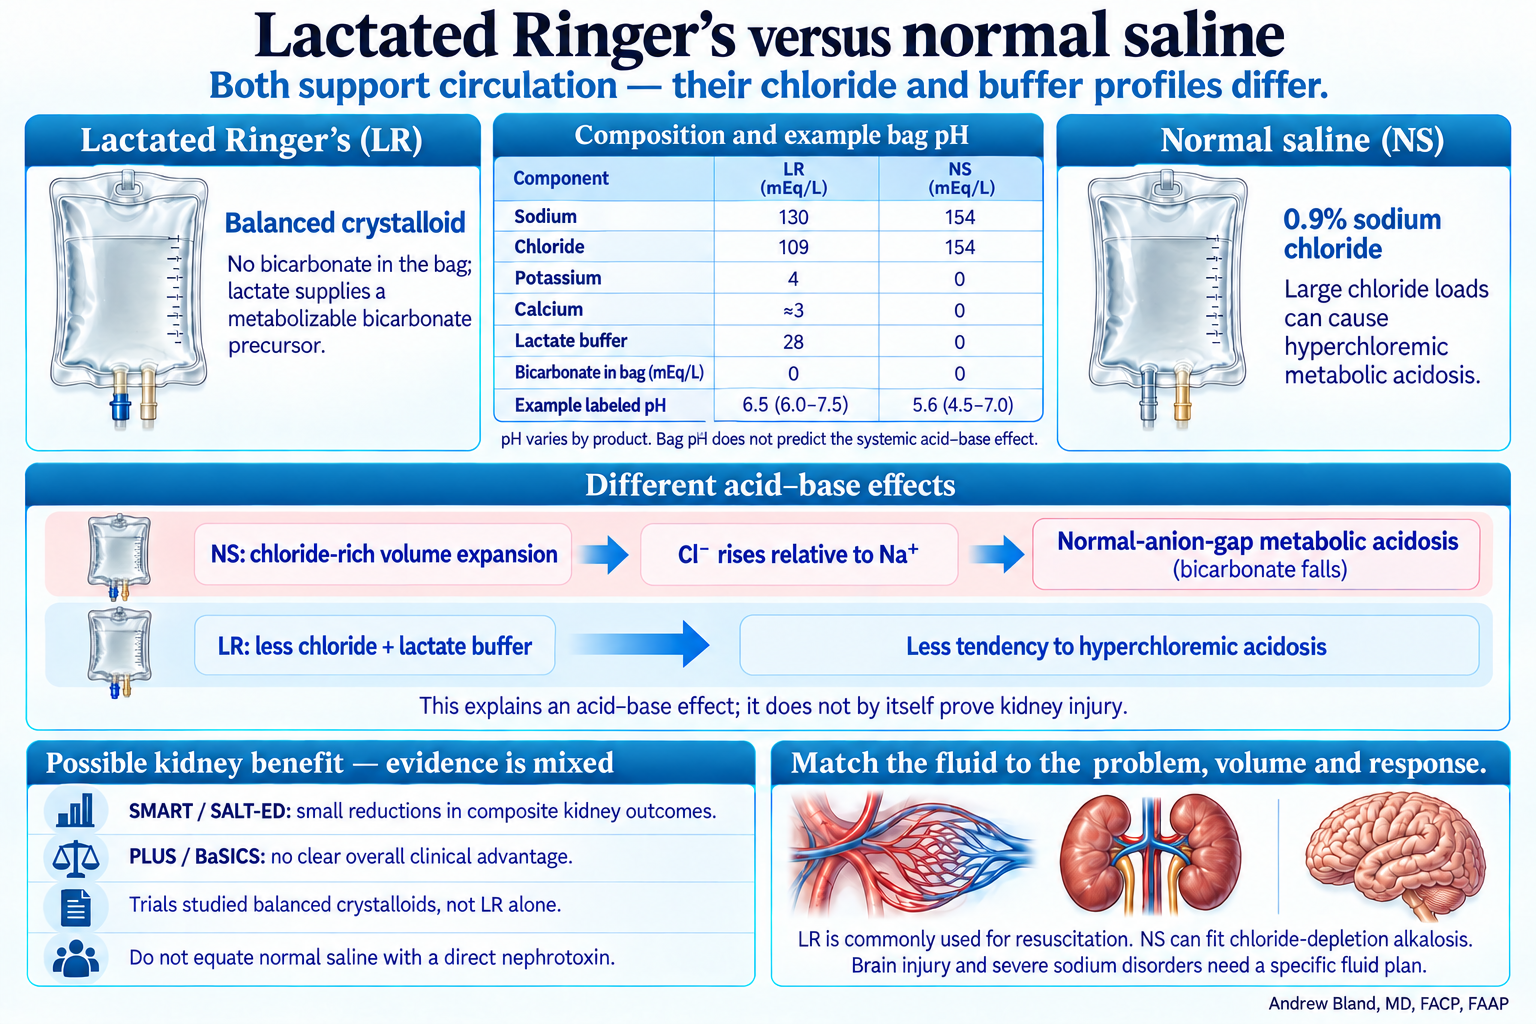
Examples from product labels: D5W pH 4.3 (3.2–6.5); 0.45% saline 5.6 (4.5–7.0); NS 5.6 (4.5–7.0); LR 6.5 (6.0–7.5); 3% saline 5.0 (4.5–7.0). These are product-specific examples, not universal constants. Bag pH is unitless and does not predict the systemic acid–base effect. Neither NS nor LR contains bicarbonate in the bag; LR supplies a metabolizable precursor.
A functioning kidney regulates balance; it does not guarantee unlimited tolerance
With adequate perfusion, solute availability and intact regulation, kidneys adjust urine water and electrolyte excretion to match changing intake and losses. They do not literally create the needed water or salt. Pain, nausea, surgery and low effective circulation can sustain ADH even when creatinine is normal, limiting excretion of an administered water load. Both excess free water and excess sodium-containing fluid can cause harm.
Adult maintenance: prescribe the need, not a default bag
Maintenance replaces ordinary ongoing needs when oral or enteral intake is insufficient; resuscitation, deficit replacement and abnormal ongoing losses are separate prescriptions. Adult comparative evidence is limited and setting-specific. NICE permits a hypotonic maintenance regimen, while the small TOPMAST surgical trial illustrates the tradeoff: more sodium-rich fluid increased retention and hyperchloremia, whereas hypotonic fluid produced more mild hyponatremia. Neither result establishes one composition as best for every adult.
Pediatrics: Holliday–Segar is an estimate, not a complete prescription
The weight-based Holliday–Segar calculation estimates maintenance water volume; it does not itself choose tonicity or guarantee that a sick child needs the full calculated amount. The strongest pediatric trial evidence concerns fluid composition: PIMS reported hyponatremia in 4% with isotonic versus 11% with hypotonic maintenance fluid. The AAP recommends isotonic maintenance solutions with appropriate dextrose and potassium for most eligible hospitalized children aged 28 days–18 years; important excluded conditions need specific plans. Rate, all other fluid sources, sodium and clinical balance still require reassessment.
Teach the bedside decision
Ask first whether IV fluid is needed, then choose the goal, composition, amount and reassessment interval. Count oral intake, feeds, medication carriers and ongoing losses. Stop IV maintenance as soon as adequate enteral intake makes it unnecessary. A resuscitation-fluid trial does not answer a maintenance-fluid question.
Example manufacturer-labeled bag pH (unitless); check the actual product
Fluid
Example pH
Labeled range
D5W
4.3
3.2–6.5
0.45% saline
5.6
4.5–7.0
0.9% saline / NS
5.6
4.5–7.0
Lactated Ringer’s
6.5
6.0–7.5
3% saline
5.0
4.5–7.0
Bag pH does not predict systemic acid–base response. Product examples and ranges are sourced in the references below.
Different chloride and buffer profiles; possible kidney benefit with mixed clinical evidence.
Composition helps explain the acid–base effect
Typical LR contains sodium 130, chloride 109, potassium 4, calcium approximately 3 and lactate 28 mEq/L; formulation details vary. Normal saline contains sodium and chloride 154 mEq/L each, with no potassium, calcium or buffer. LR is commonly grouped with isotonic resuscitation crystalloids, although its measured osmolarity is slightly below plasma.
Neither bag contains bicarbonate
Both LR and NS contain zero bicarbonate in the bag. LR provides lactate as a metabolizable bicarbonate precursor; NS has no buffer anion. Saline-associated hyperchloremic acidosis is sometimes described as dilutional or expansion acidosis, but chloride-rich composition—not volume expansion alone and not the acidity of the bag—is the central teaching point.
Example bag pH is not the systemic acid–base effect
Example manufacturer labels list LR at pH 6.5 (range 6.0–7.5) and NS at pH 5.6 (4.5–7.0). Values vary by product and container. Bag pH is unitless and does not measure the delivered titratable acid load or predict the patient’s response; the chloride burden, metabolizable anions, dose and patient physiology matter far more.
Why chloride rises while bicarbonate falls
A large chloride-rich saline load can raise chloride relative to sodium, lower the plasma strong-ion difference and produce a normal-anion-gap metabolic acidosis. This is not a claim that saline directly triggers bicarbonate loss at a particular tubular transporter. LR supplies less chloride and lactate that can be metabolized to a bicarbonate equivalent; the lactate anion is not an infusion of lactic acid.
What the trials support—and what they do not
SMART found a small reduction in a composite of death, new dialysis or persistent renal dysfunction with balanced crystalloids. SALT-ED found a similar secondary kidney-composite signal, while its primary hospital-free-days outcome was unchanged. The large blinded PLUS and BaSICS trials did not establish a clear overall advantage in their primary mortality outcomes; PLUS also found similar kidney outcomes. These trials tested balanced-crystalloid strategies, sometimes LR or Plasma-Lyte and sometimes Plasma-Lyte alone. They do not prove that LR universally prevents AKI or that normal saline is a direct nephrotoxin.
Choose the fluid for the clinical problem
A possible modest kidney benefit and less hyperchloremic acidosis support considering balanced crystalloids when appropriate. Chloride-depletion alkalosis may favor saline. Brain injury, severe sodium disorders, compatibility issues and specific electrolyte problems require a tailored plan. Fluid volume, indication and repeated reassessment remain central; these resuscitation studies should not be treated as proof of the best maintenance regimen.
A small set of familiar tests can open the door to many different kidney problems—when we interpret them together.
Start with the basics: blood work, urinalysis, and kidney imaging. The key is the pattern across these findings, interpreted alongside the history, medications, examination, and previous results.
The kidney’s product is homeostasis. Blood tests show the internal environment; urine shows clues to the kidney’s response; imaging adds anatomy and the possibility of obstruction.
Opening question: What finding first brought this patient’s kidneys to your attention?
Creatinine and BUN may bring kidney function to attention. Sodium, potassium, chloride, and bicarbonate reveal water, electrolyte, and acid–base problems. Review calcium, magnesium, and phosphorus when relevant.
Start with the BMP, then compare with the patient’s baseline. A creatinine value needs a date and a trend.
Blood, protein, specific gravity, and the sediment can reveal a problem even when creatinine is normal. Microscopy helps interpret dipstick findings.
Urine albumin-to-creatinine ratio (UACR) quantifies albumin loss. Urine electrolytes and osmolality are additional tests when the clinical question requires them; they are not all part of a routine urinalysis.
Hydronephrosis, stones, cysts, masses, or changes in kidney size may be the first clue. Sometimes the abnormality is found incidentally during imaging for another problem.
Imaging can suggest obstruction or chronic structural disease. Interpret the finding with the history and laboratory results; not every incidental cyst explains impaired function.
Pause and connect: Which finding is the entry point? What would the other two parts of the key add? Topic links open in a new tab so you can return to the lecture.
06 · From a blood result to filtration
Creatinine: a window into kidney function
Serum creatinine (Cr) is a practical blood marker of kidney filtration. It comes largely from muscle creatine metabolism, is freely filtered at the glomerulus, and is also secreted by the proximal tubule. Its blood concentration reflects the balance between production and removal.
GFR is the filtration rate
Glomerular filtration rate describes how much plasma the kidneys filter per minute. With stable creatinine production and handling, a lower GFR generally means a higher serum creatinine once a new steady state is reached. The relationship is inverse and nonlinear.
eGFR is an estimate
Creatinine-based equations combine the blood result with factors such as age and sex to estimate GFR. Muscle mass, diet, and medicines that alter creatinine secretion can affect the estimate. A creatinine inside the laboratory reference range can still accompany reduced filtration.
Read function with context
Compare the baseline and trend. During AKI, creatinine lags behind a changing GFR. Pair filtration with urine albumin and sediment: albuminuria can reveal injury despite a preserved eGFR. GFR alone does not describe every tubular or hormonal kidney function.
Connect the number to the physiology: Blood flow, afferent and efferent arteriolar tone, and filtration pressure influence GFR. Creatinine is a downstream clue to that process; it does not identify the cause by itself.
Start with Normal Physiology, then compare NSAIDs and ARB / ACEi. Which arteriole changes, and what happens to glomerular pressure and GFR?
If creatinine production and handling stay constant, which direction would serum creatinine move after a new steady state is reached? Why would it take time?
Return to albuminuria and macula-densa feedback: how can changing pressure affect both filtration and long-term glomerular stress?
The model illustrates physiologic relationships; its displayed numbers are teaching examples. Interpret a patient’s creatinine change with the full clinical picture.
Albumin/creatinine: pressure, permeability, and risk
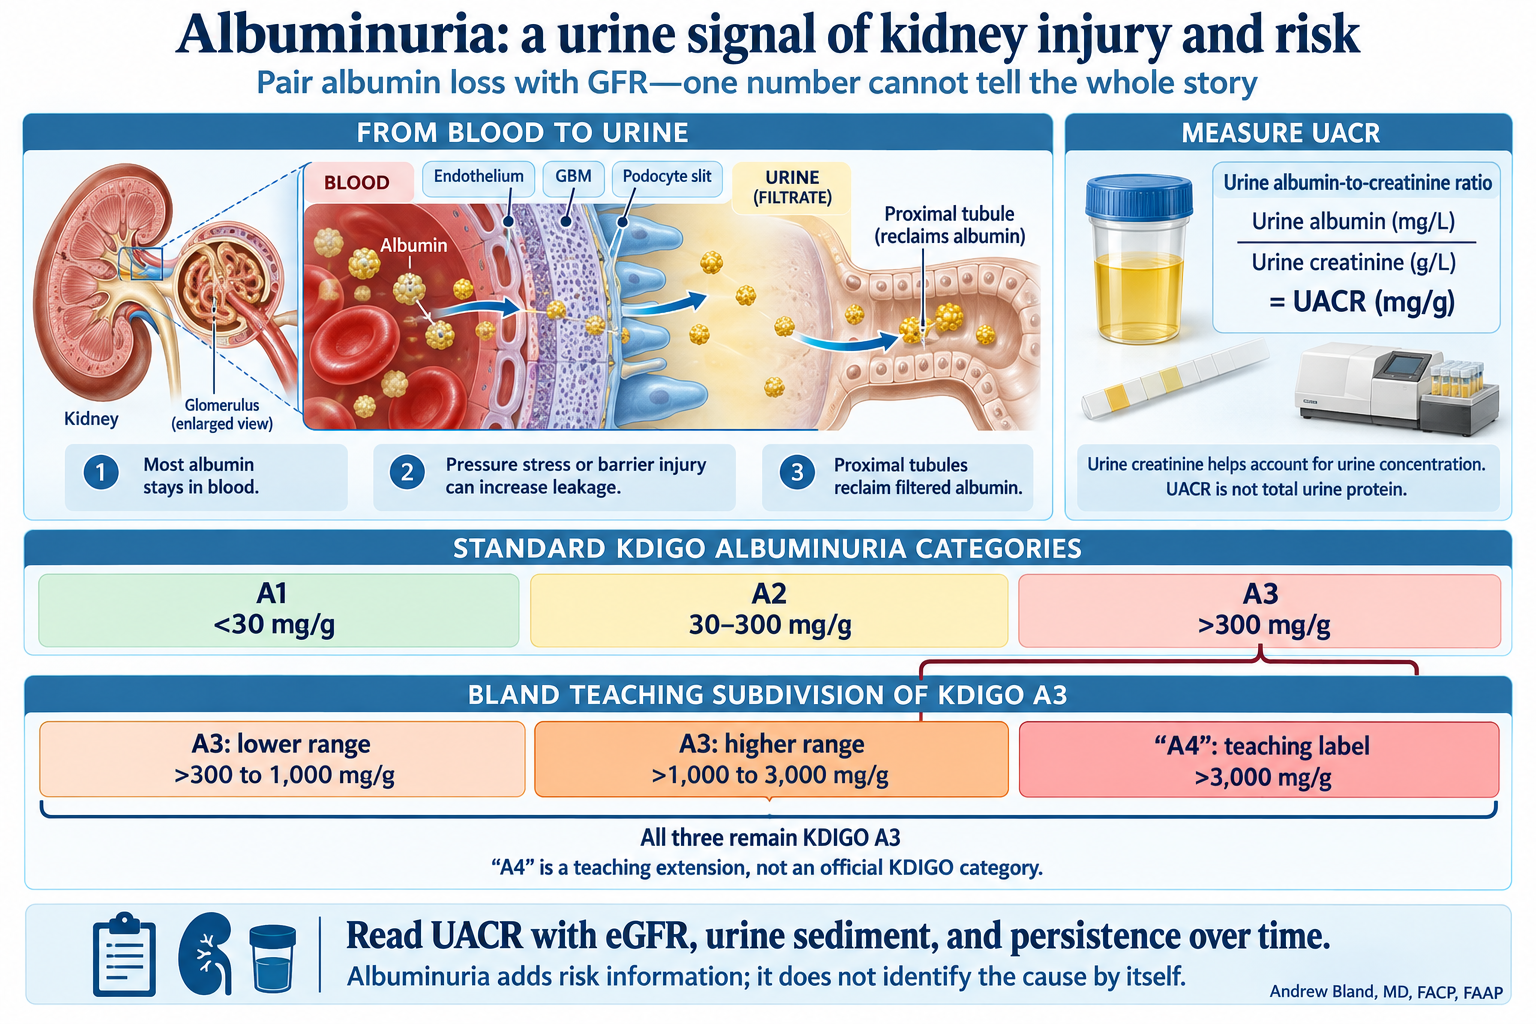
Urine albumin-to-creatinine ratio (UACR, or Alb/Cr) estimates albumin loss while accounting for urine concentration. Albuminuria can be a clue to intraglomerular hypertension and hyperfiltration-related stress, or to inflammatory injury of the glomerular filtration barrier.
Use urine values in the ratio: urine albumin (mg/L) ÷ urine creatinine (g/L) = UACR (mg/g). The urine creatinine helps account for urine concentration; it is not the serum creatinine used to estimate GFR. Differences in creatinine excretion can still influence the ratio.
Three teaching buckets inside the broad A3 category
Bland teaching categories · UACR in mg/g
Teaching label
UACR
Standard KDIGO category
A1
<30
A1
A2
30–300
A2
A3: lower range
>300 to 1,000
A3
A3: higher range
>1,000 to 3,000
A3
“A4”: teaching label
>3,000
A3
The scorecard-inspired teaching extension separates the broad A3 band into three buckets. The upper boundary belongs to the preceding bucket: 1,000 is in the lower A3 range, 3,000 is in the higher A3 range, and values above 3,000 enter the teaching “A4” bucket. “A4” is not an official KDIGO category; all three buckets remain KDIGO A3.
A4 has a published history. The Canadian Society of Nephrology’s 2015 AJKD commentary proposed A4 for nephrotic-range albuminuria (ACR >2,220 mg/g). AJKD is the NKF journal. This lecture uses >3,000 mg/g for its teaching A4; current KDIGO remains A1–A3.
Ask the room: Two people both have persistent eGFR 52, but UACR is 400 in one and 4,000 mg/g in the other. Both are KDIGO G3a A3; what important difference does the broad label hide? The extended view makes the magnitude of albumin loss visible. It does not give an individual risk percentage or diagnose nephrotic syndrome by itself.
Pressure and hyperfiltration
Excess pressure and filtration workload in individual nephrons can promote albumin leakage. A normal or high whole-kidney eGFR does not rule out injury; surviving nephrons may also hyperfilter when total GFR is reduced.
Inflammation and barrier injury
Glomerular inflammation can allow albumin and blood into urine. Use the sediment, clinical presentation, and other testing to determine the cause.
A marker, not a mechanism test: UACR does not directly measure hyperfiltration or prove inflammation. Interpret it with GFR, microscopy, and the timeline. Fever, infection, or exercise may transiently raise it; confirm persistence when assessing CKD.
Albumin is not all urine protein. A low UACR does not exclude excess free light chains. Disproportionately high total urine protein with little albumin can be a clue to a non-albumin protein process.
The macula densa: a salt sensor, not a volume gauge
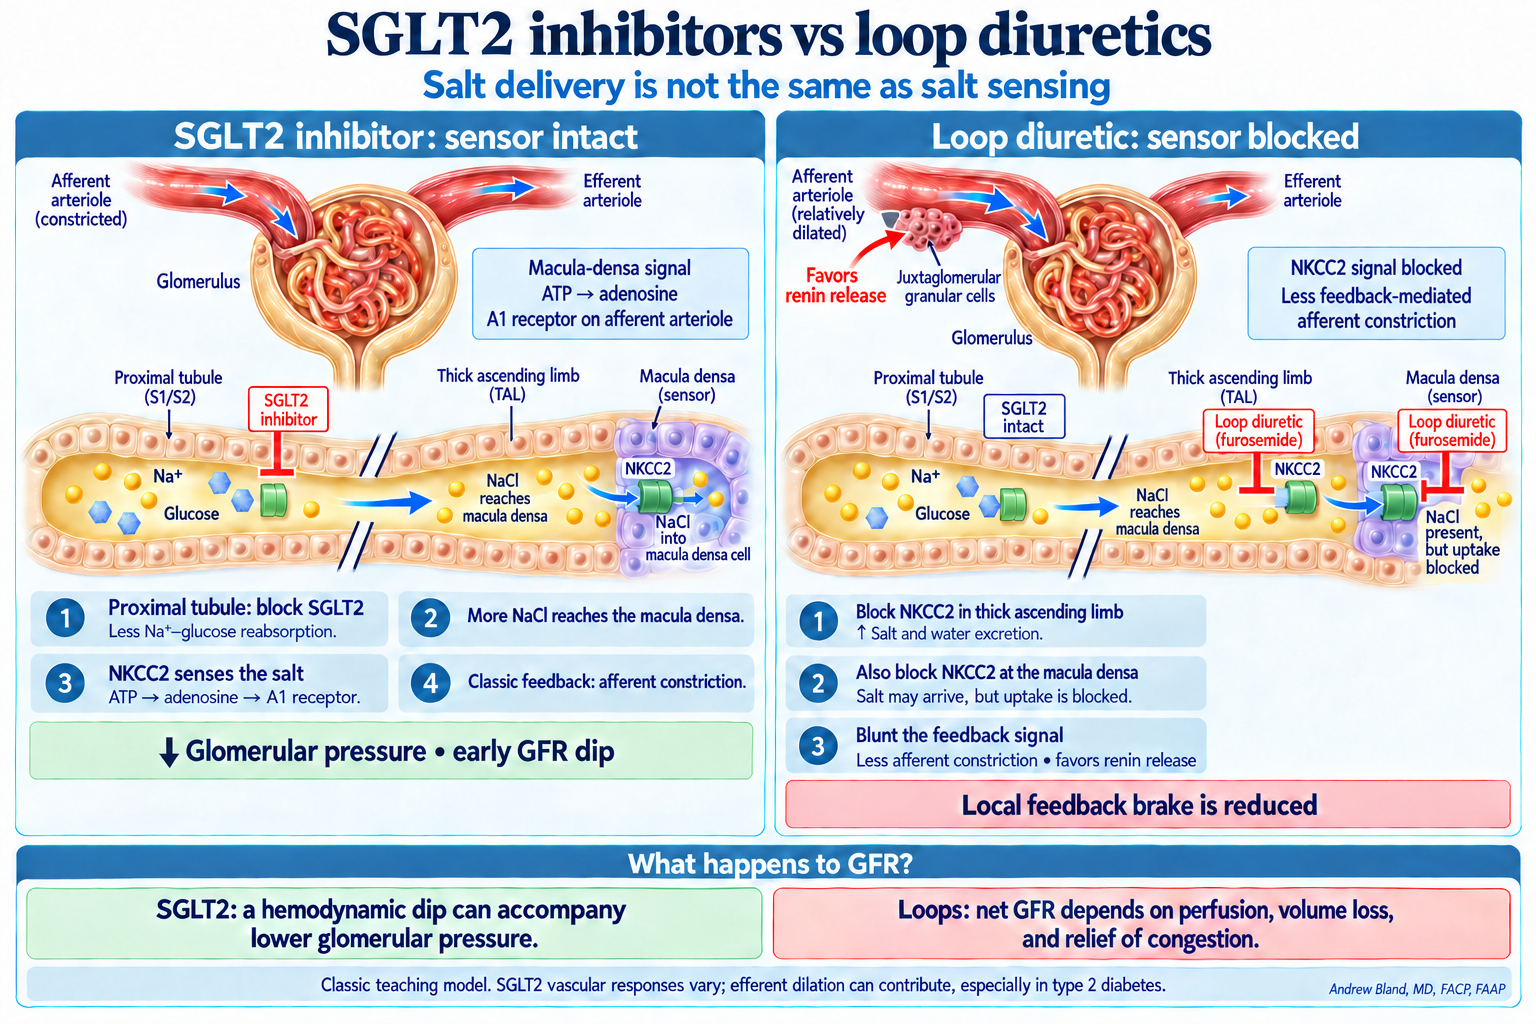
At the end of the thick ascending limb, the macula densa samples tubular NaCl using NKCC2: 1 Na⁺ + 1 K⁺ + 2 Cl⁻. Salt delivery reflects filtration and upstream reabsorption. It provides an indirect signal about perfusion and delivery; it does not directly measure blood volume or serum sodium.
Classic tubuloglomerular feedback: more NaCl sensed → ATP/adenosine signaling → afferent arteriolar constriction → reduced filtration pressure. Low salt delivery promotes renin release and RAAS activation.
Feedback can reduce hyperfiltration and intraglomerular pressure.
Teaching model: restore the signal and apply the afferent “brake.”
Loop diuretic · sensor blocked
Inhibit NKCC2 in the thick ascending limb and macula densa.
Increase salt excretion.
Block the macula densa’s NKCC2 signal despite salt delivery.
Blunt this feedback-mediated afferent constriction and favor renin release.
Teaching model: “blind the sensor.” Volume loss and other signals can still change kidney perfusion and GFR.
Ask the room: if both drugs cause natriuresis, why is the feedback different?
SGLT2 inhibition: delivery increases while the NKCC2 sensor remains functional. A loop diuretic: salt can be present in the lumen while NKCC2-mediated sensing is inhibited. More salt delivered is not the same as more salt sensed.
Then ask: Does a loop diuretic therefore always raise GFR? No. The local feedback brake is reduced, but volume depletion may lower perfusion and GFR; relief of congestion can help kidney function. Interpret the net response in the patient’s clinical context.
Keep the model accurate: SGLT2 responses are not identical in every patient
Afferent constriction is the classic explanation, especially in hyperfiltering type 1 diabetes. Human studies in type 2 diabetes also show responses consistent with efferent vasodilation. The shared concept is reduced intraglomerular pressure; the balance of vascular responses depends on the physiology.
Negatively charged membrane components and binding sites can attract positively charged molecules. In the proximal tubule, binding and receptor-mediated uptake can concentrate some drugs inside cells. Charge helps explain susceptibility; it is one part of a larger mechanism.
Aminoglycosides
These polycationic antibiotics interact with negatively charged sites and the uptake receptor megalin. Proximal-tubule accumulation, including within lysosomes, contributes to cellular injury.
Vancomycin also undergoes tubular uptake, with experimental evidence implicating megalin. Kidney injury depends on exposure, duration, cellular injury pathways, concurrent nephrotoxins, and the patient’s condition.
A simple “less positive, so more is needed” rule does not reliably explain its toxicity or guide dosing.
Monoclonal free light chains—components of antibodies—can injure proximal tubules, form obstructing casts with uromodulin downstream, or contribute to deposits. Protein structure, concentration, and the site of injury matter; positive charge alone does not explain myeloma kidney disease.
Connect back to the key: Tubular injury may appear as rising creatinine, electrolyte losses, or abnormal urine protein. Glomerular albumin leakage and tubular drug uptake involve different structures and mechanisms.
Ask two questions: What was already present? And what has changed now? The same patient can have a chronic kidney problem and a new acute injury.
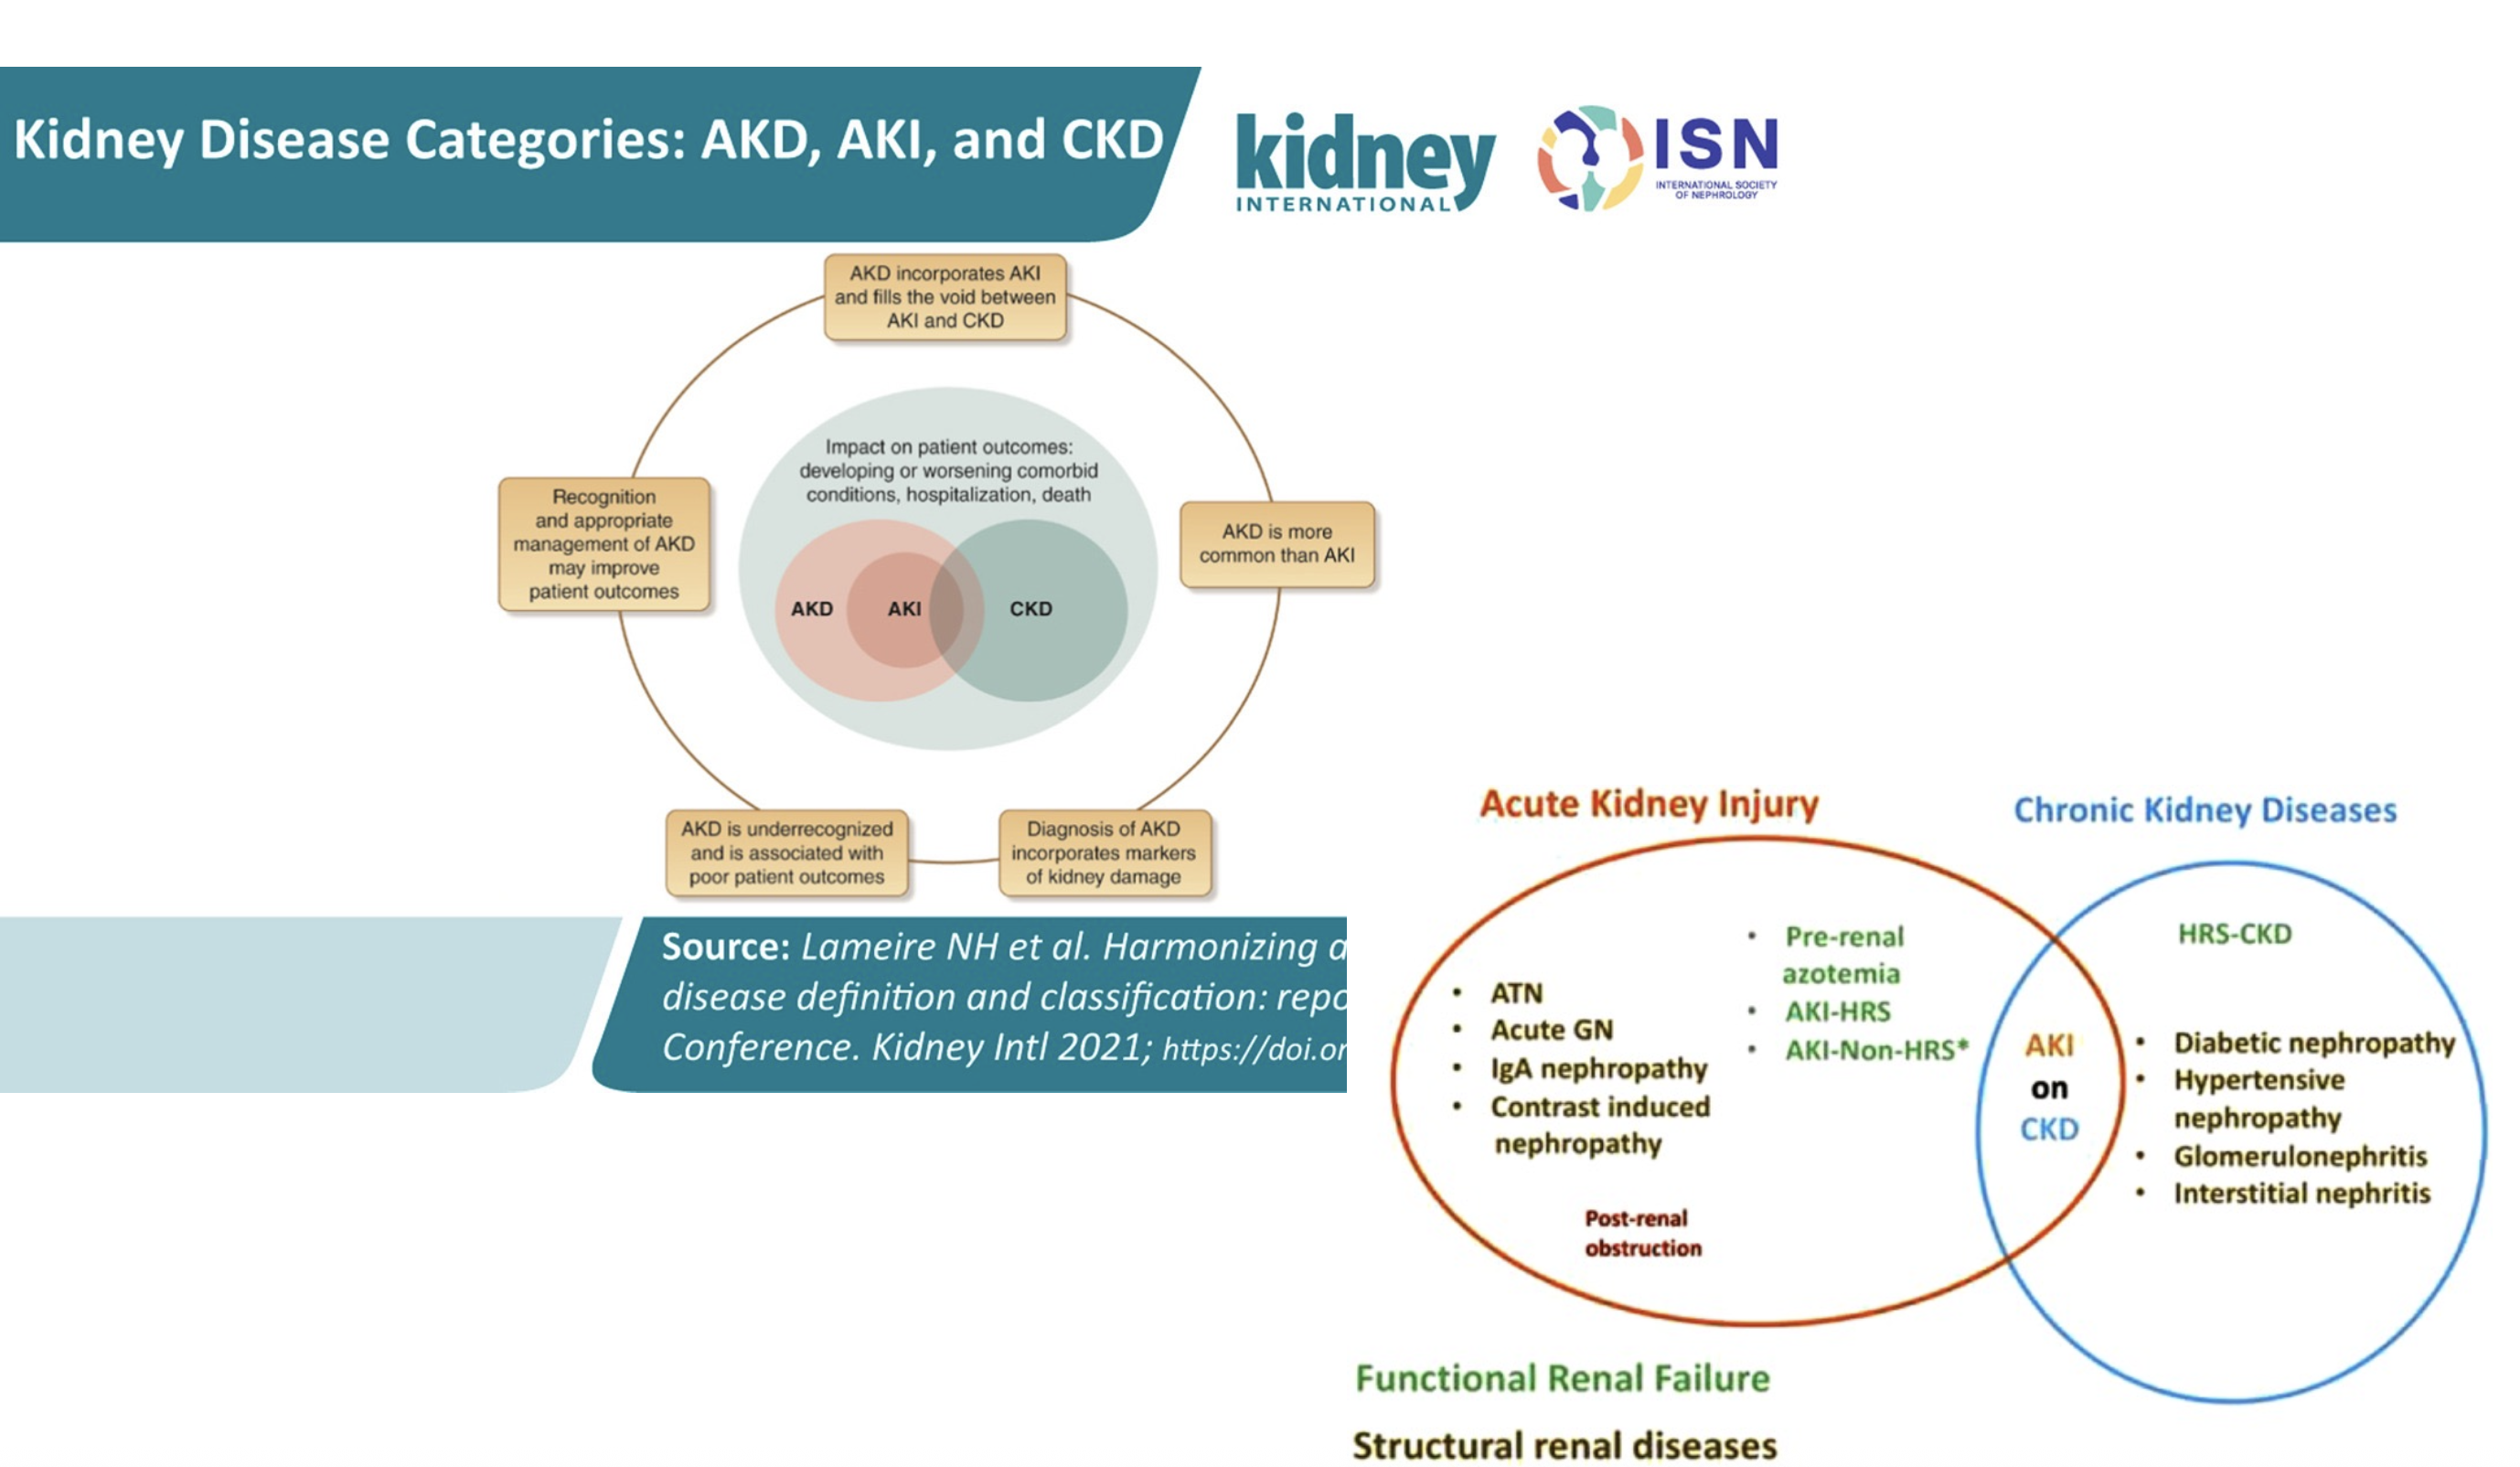
The course AKI–AKD–CKD diagram. Focus on the overlap: AKI on CKD. The disease examples illustrate possible patterns rather than exclusive categories; a disease can have acute and chronic manifestations. · Visual library: timeline and attribution
Acute
A new change over hours to days. Compare creatinine with a known baseline and assess urine output.
Chronic
Evidence of abnormal kidney structure or function for at least three months. Prior results matter.
Acute on chronic
A new injury superimposed on established CKD. Describe both the background disease and the current change.
Where does AKD fit? Acute kidney disease is the broader category of kidney abnormalities lasting up to three months and includes AKI. Persistent dysfunction after an acute episode requires reassessment; AKI does not inevitably become CKD.
Discuss the diagram: A patient with a year of reduced kidney function develops vomiting and a new creatinine rise. Why is “AKI on CKD” more informative than choosing only one label?
CKD requires persistent kidney abnormalities for at least three months. Describe the cause, GFR category, and albuminuria category. GFR alone does not tell the whole story.
Move down for lower GFR; move across for greater albuminuria. Both affect risk. Select a cell to discuss its meaning.
The standard view uses KDIGO A1–A3. The teaching view subdivides A3 into >300–1,000, >1,000–3,000, and “A4” >3,000 mg/g. The same KDIGO risk colors apply within A3; these subdivisions do not create additional validated risk classes. Read the historical A4 context.
CKD prognosis categories · GFR in mL/min/1.73 m² · UACR in mg/g
GFR category
A1 <30
A2 30–300
A3 >300
G1 ≥90
G2 60–89
G3a 45–59
G3b 30–44
G4 15–29
G5 <15
Choose any cell. Compare G3a A1 with G3a A3: the same GFR category can carry very different risk.
Green needs context: G1 or G2 with A1 is not CKD unless another marker of kidney damage is present. One abnormal result cannot establish chronicity. This teaching grid shows broad risk groups, not an individual probability of kidney failure.
Discussion: same GFR, different urine
Two patients have a stable eGFR of 52 for six months. One has UACR 12 mg/g; the other, persistently 650 mg/g. They share G3a but fall in A1 and A3. The urine result changes the risk assessment.
Creatinine is a concentration that takes time to respond to a change in filtration. Routine creatinine-based eGFR equations assume a relatively steady state. When creatinine is changing rapidly, the reported eGFR may misrepresent current kidney function.
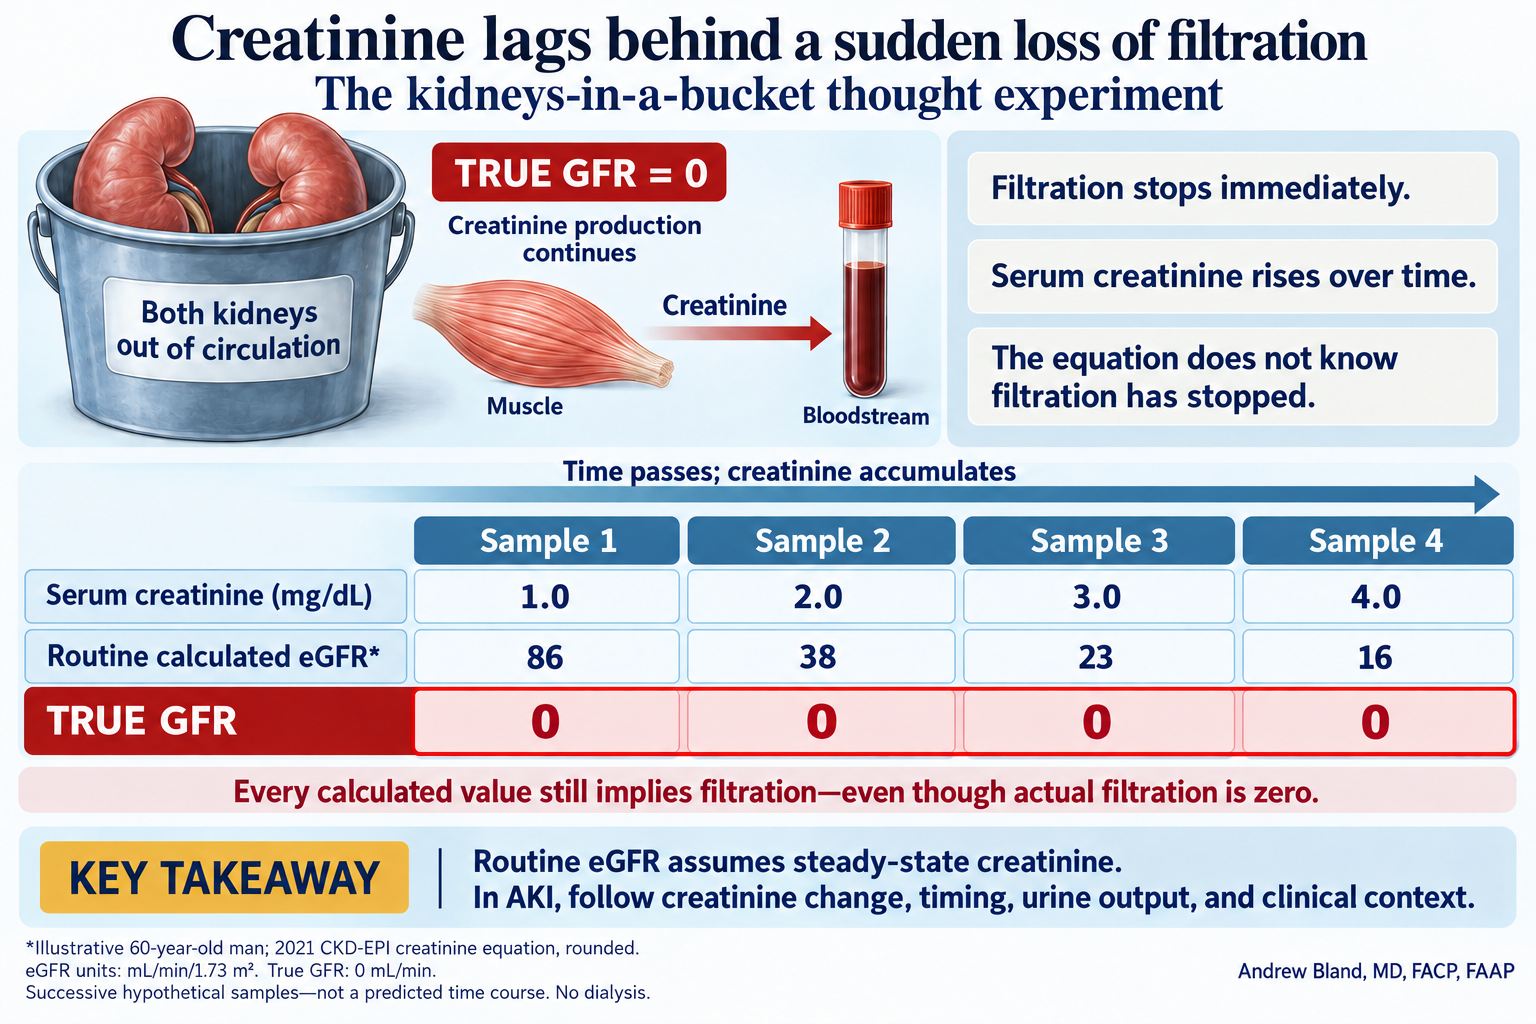
Your kidneys in a bucket: creatinine changes while GFR stays at zero
Imagine taking both kidneys out of the circulation and placing them in a bucket. The patient’s true GFR is immediately zero, but the creatinine already in the blood does not instantly change. Muscle continues producing creatinine, so its concentration rises over time.
The changing creatinine does not require another change in GFR: filtration stays at zero throughout this thought experiment. The routine equation still returns positive numbers because it assumes steady-state creatinine. These values are not all normal, but every one overestimates actual filtration here.
Same patient, four hypothetical samples after filtration stops
Sample
Serum creatinine (mg/dL)
Routine calculated eGFR (mL/min/1.73 m²)
True GFR (mL/min)
1
1.0
86
0
2
2.0
38
0
3
3.0
23
0
4
4.0
16
0
Illustrative 60-year-old man; 2021 CKD-EPI creatinine equation, rounded. These are successive hypothetical samples, not fixed time intervals or a predicted rate of rise. No dialysis is assumed. In real AKI, creatinine production, distribution volume, and residual clearance also affect the trajectory.
Ask the room: When creatinine rises from 2 to 4, did GFR fall again? No—true GFR was already zero. What is changing is the concentration of a substance that continues to accumulate.
Use this in AKI: Follow the creatinine change and timing, urine output, and the clinical picture. Do not treat a routine reported eGFR as current measured filtration or use it to assign a CKD stage during a rapidly changing episode. Specialized kinetic estimates address a different question; they are not the routine laboratory eGFR.
After filtration falls, creatinine accumulates. The reported eGFR can overestimate current filtration while creatinine is still rising.
Creatinine falling
During recovery, creatinine takes time to fall. The reported eGFR can underestimate improving filtration.
Recognize AKI using the change and timing: creatinine rises by ≥0.3 mg/dL within 48 hours, or to ≥1.5 times baseline within the prior seven days; urine output <0.5 mL/kg/hour for six hours is another criterion. AKI can occur with preserved urine output.
Illustrative teaching example · serum creatinine
Two days ago
Today
The important observation
1.0 mg/dL
1.6 mg/dL
A rise of 0.6 mg/dL in 48 hours meets a creatinine criterion for AKI.
Why not assign a CKD stage from today’s eGFR?
The creatinine is not at steady state, and a two-day change does not establish chronic kidney disease. Review the baseline, urine output, volume status, medications, urinalysis, and possible obstruction. Describe the acute trajectory and reassess after stabilization.
Ask before interpreting a number: What was the baseline? When was it measured? Is creatinine rising, falling, or stable?
Both AKI and CKD live in the clinic and the hospital
Pattern
Outpatient encounter
Inpatient encounter
AKI
A new creatinine rise after a diarrheal illness, a medication change, or urinary retention.
A new creatinine rise with sepsis, surgery, or acute heart failure.
CKD
Persistent albuminuria or reduced GFR during longitudinal follow-up.
Established CKD that changes how we interpret an admission and its complications.
AKI on CKD
A patient with CKD develops an acute illness between clinic visits.
The same patient is admitted with an acute change on top of a chronic baseline.
A clinic result may reveal an urgent problem. A hospital patient may have a stable chronic abnormality. The timeline defines the pattern; severity and clinical context determine the urgency.
14 · One patient, several disturbed systems
Expect combinations of disorders
Volume loss + hormonal response
Vomiting can combine chloride loss, metabolic alkalosis, and potassium depletion. Reduced effective circulation activates RAAS and ADH; impaired perfusion may add AKI. The blood and urine reflect both the illness and the kidney’s response.
CKD + several lost functions
Reduced excretory and endocrine reserve can combine hypertension or fluid overload, hyperkalemia, metabolic acidosis, anemia, and altered phosphate–vitamin D–PTH balance. Not every patient has every abnormality.
Proximal injury + multiple urine losses
Some light-chain disorders cause proximal tubular dysfunction: phosphate and bicarbonate wasting, glycosuria despite normal blood glucose, and other losses. The combination suggests a tubular process, sometimes a Fanconi syndrome.
Use physiology to organize the combination: Which nephron function is affected? Which hormones are responding? What is an appropriate compensation, and what represents additional disease?
“We will use cases based on clinical problems I have seen in the real world to show how these nephrology concepts interrelate and overlap.” — Andrew Bland, MD, FACP, FAAP
The cases are fictionalized for teaching. The clinical reasoning is the point: an electrolyte problem may also be a medication problem, a volume problem, and AKI on CKD.
Illness + medications + kidney function
Use the blood results and timeline to connect an acute illness with the chronic background.
Carry these questions into every case: Which kidney jobs and hormonal responses connect the findings? What brought the problem to attention? What is acute, chronic, or both? How do the blood work, urine, and imaging fit together?
Follow these ideas through the case series
The linked topic lectures above are supplementary explanations. The five sessions below organize the assigned case discussions and self-study.
Mechanism studies are linked beside the relevant discussion above. Additional sources for kidney function, hormonal complications, and the AKI–CKD framework:
The overlap image is the existing course teaching graphic. The standard heat-map view renders KDIGO’s conventional GFR–albuminuria risk categories. The optional Bland teaching view subdivides A3 without changing its KDIGO classification or risk colors.
Use this visual teaching sequence before the first question. Return to the relevant framework as new findings appear; commit to your interpretation before opening the answer.
1. Approach
Read potassium with the ECG; distinguish protection, redistribution and removal.
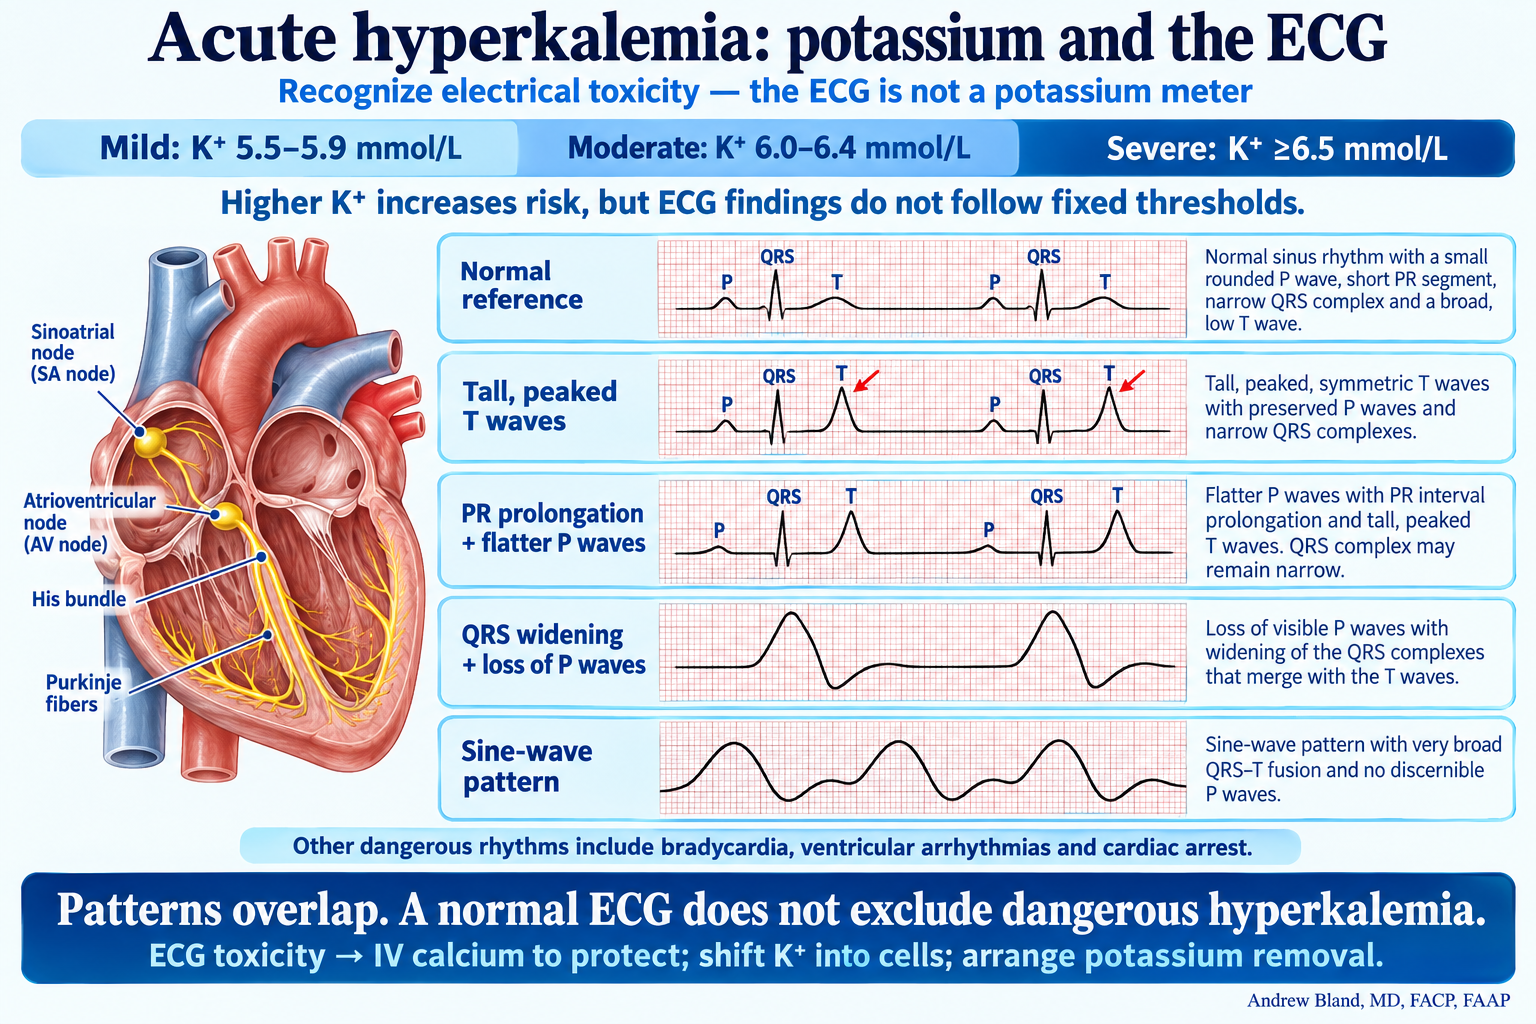
Recognize electrical toxicity; the ECG does not measure potassium.
Read the level and the tracing together
The UK Kidney Association classifies potassium 5.5–5.9 mmol/L as mild, 6.0–6.4 as moderate and ≥6.5 as severe hyperkalemia. The tracing can show peaked T waves, PR prolongation, P-wave flattening or disappearance, QRS widening and eventually QRS–T fusion. These are illustrative patterns, not potassium-specific thresholds or a dependable sequence.
Treat electrical toxicity promptly
A normal ECG does not exclude severe hyperkalemia. Interpret the potassium trend, symptoms, kidney function and ECG together. With convincing ECG toxicity, protect the myocardium with IV calcium while arranging potassium redistribution and removal. Calcium does not lower potassium. The clean repeat specimen and definitive treatment proceed alongside emergency care.
Compare current weight with the patient's usual weight, then combine jugular venous pressure, lung findings, edema, blood pressure and symptoms. A single finding is less reliable than a consistent pattern. Congestion can coexist with poor effective circulation.
Calcium stabilizes the cardiac membrane. Insulin and beta agonists shift potassium into cells temporarily. Dialysis, gut binders and useful urinary excretion remove potassium from the body. A lower serum concentration after a shift does not prove that body potassium has been removed.
Calcium protection and intracellular shifts have different clocks; start removal planning immediately.
Calcium: prioritize conduction toxicity
Hyperkalemia-associated QRS widening, a sine-wave pattern, dangerous bradycardia or ventricular arrhythmia, and suspected hyperkalemic arrest are urgent reasons for IV calcium. Isolated peaked T waves are less specific and were not associated with short-term adverse events in one observational study; they are not equivalent to QRS widening. However, calcium guidance differs: UKKA includes isolated hyperkalemic peaked T waves. Teach the distinction without a blanket rule to withhold calcium. Use the emergency protocol and the whole clinical picture.
Calcium buys a short interval
The ECG effect begins in about 1–3 minutes and lasts roughly 30–60 minutes. Reassess promptly; persistent or recurrent toxicity may require repeat calcium while shifting and removal proceed. Calcium does not reduce serum or total-body potassium. Formulations are not dose-equivalent: calcium chloride contains about three times the elemental calcium per equal volume of a 10% solution. Follow the local formulation, dose, route and repeat-dose protocol.
Insulin plus dextrose: an early shift with a later glucose risk
IV regular insulin begins lowering potassium in about 15 minutes, with peak effect around 30–60 minutes. The shift may persist for 4–6 hours, but potassium can begin rebounding earlier. Dextrose supports blood glucose; it does not make the insulin effect harmless or guarantee six hours of protection. Check glucose before treatment and frequently for at least six hours afterward, extending monitoring after repeat doses or in high-risk patients. Kidney failure increases delayed hypoglycemia risk.
Albuterol: a hyperkalemia dose, not an ordinary bronchodilator treatment
The studied adult nebulized dose is 10–20 mg total, substantially more than a routine 2.5 mg nebulizer treatment. Specify total dose and delivery time with respiratory therapy under the local protocol. A rate such as 20 mg/hour is not interchangeable with a total 20 mg dose and should not be taught as an indefinite standard infusion. Potassium lowering generally begins by about 30 minutes and lasts at least two hours, commonly about 2–4 hours; some responses last longer. Response varies, so use it as an adjunct, not sole therapy for severe hyperkalemia. Watch for tachycardia, tremor and ischemic symptoms.
Bicarbonate: do not assign it a dependable potassium clock
IV bicarbonate is not routinely effective as acute hyperkalemia monotherapy. It may be useful when clinically important metabolic acidosis supplies a separate indication, with attention to sodium, volume and ventilation. The magnitude, onset and duration of potassium lowering are inconsistent; a fixed two-hour or six-hour rescue window would be misleading. In a small crossover study of hemodialysis patients, bicarbonate alone did not lower potassium during the first hour.
Recheck the patient, not just the first improved number
Continue ECG monitoring when indicated, repeat potassium early after treatment and again as the shift wears off, and track glucose separately. A useful monitored framework checks potassium around one and two hours, then four and six hours, with earlier or additional testing for instability or a changing trajectory. Calcium can wear off before dialysis starts; shifted potassium remains in the body. Reassess and bridge until actual removal provides sustained control.
Learn first: Separate the patient from the specimen
Hemolysis releases potassium into the blood sample after collection; it cannot produce the patient's ECG changes. When hyperkalemia is suspected and the ECG shows toxicity, treat the cardiac threat while obtaining a reliable repeat sample.
Bactrim contains trimethoprim and sulfamethoxazole. Trimethoprim acts like amiloride: it blocks the urine-facing epithelial sodium channel (ENaC) in the distal nephron. Less sodium reabsorption makes the tubular lumen less negative, reducing the electrical drive for potassium secretion into urine. Serum potassium can rise even without a fall in GFR.
In this case, residual kidney function makes that mechanism plausible; missed dialysis and a potassium salt substitute add to the problem. ACE inhibitors can add risk by reducing aldosterone activity. Urine volume alone does not quantify potassium clearance, and this renal mechanism should not be extrapolated to a truly anuric patient.
Learn first: Urgent dialysis is about complications
Use AEIOU: severe or refractory Acidosis, dangerous Electrolyte disturbance, dialyzable Intoxication, refractory fluid Overload and symptomatic Uremia. Creatinine alone does not determine urgency. Several complications can reinforce the same decision.
Saline helps a depleted circulation but can worsen congestion. Residual urine may permit a loop-diuretic response. In a dialysis-dependent patient with dangerous hyperkalemia and pulmonary edema, that possible response must not delay dependable potassium and fluid removal.
Calcium's effect is temporary and does not lower potassium. Shifting therapies cover the interval before dialysis and require glucose, ECG and potassium reassessment. Lokelma provides gastrointestinal potassium removal and can be an adjunct while HD is arranged; with cardiovascular compromise it is not sole emergency treatment.
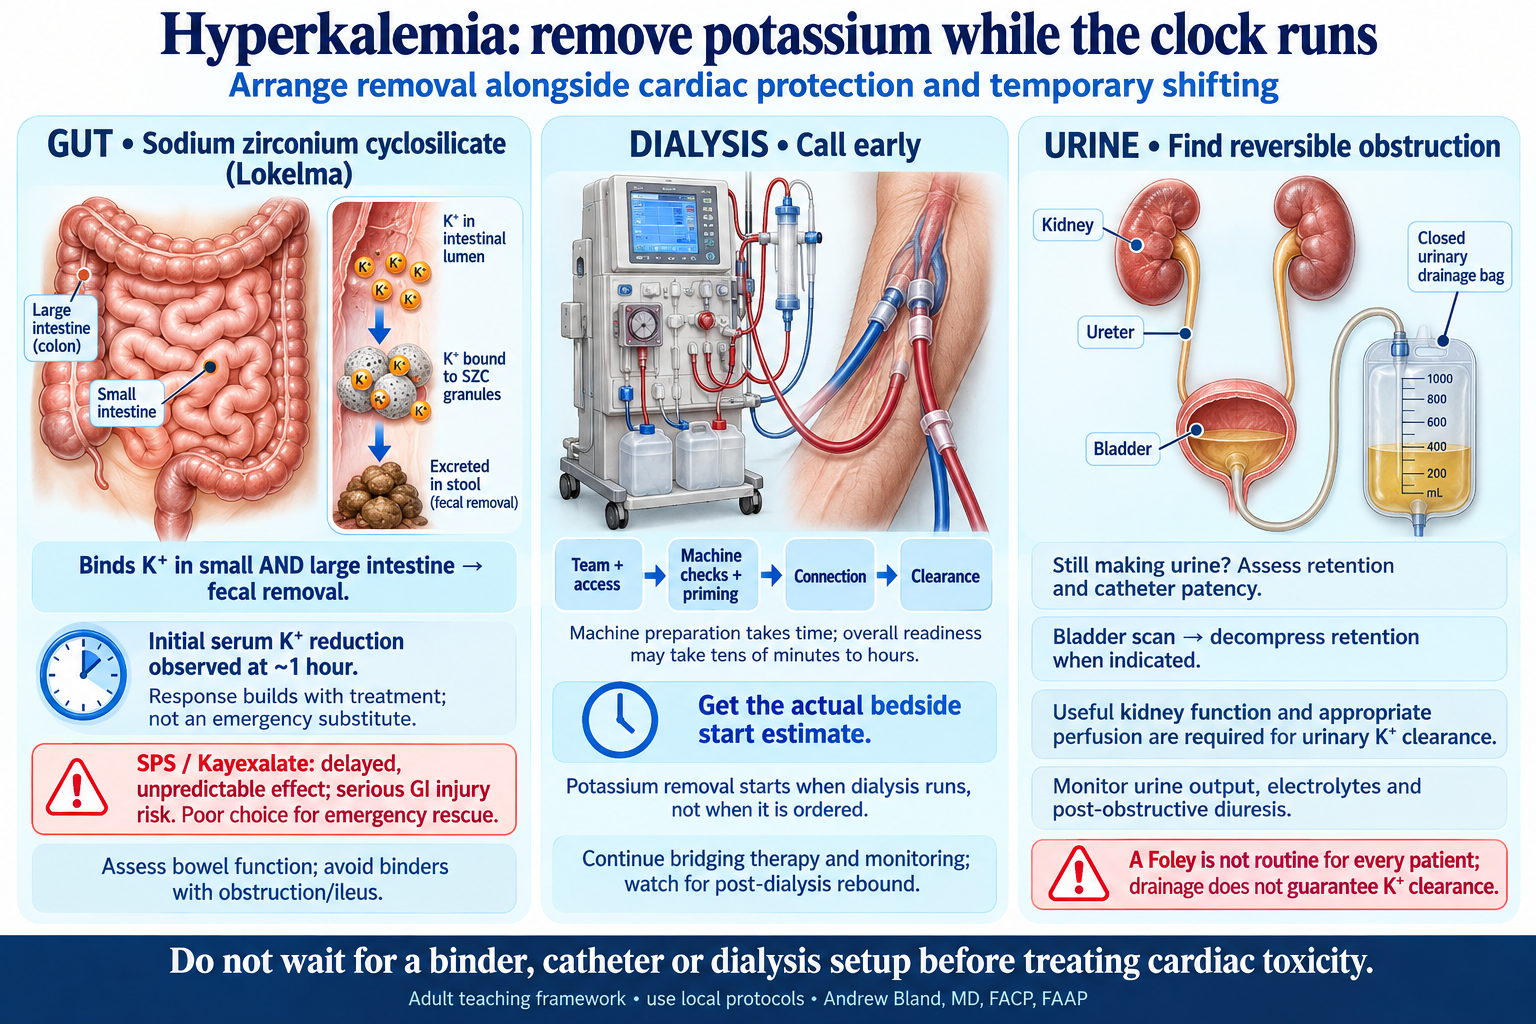
Gut, dialysis and useful urinary clearance are removal routes; none should delay cardiac stabilization.
Lokelma: early gut binding is useful, but it is not immediate rescue
Sodium zirconium cyclosilicate (SZC; Lokelma) binds potassium within the gastrointestinal lumen, including both the small and large intestine, and increases fecal potassium loss. With the studied initial regimen of 10 g three times daily, serum potassium reduction was observed at one hour and continued over the following 48 hours. That is an onset signal, not a guarantee of adequate correction at one hour. The US label states that it should not be used as emergency treatment for life-threatening hyperkalemia. It may be an adjunct while effective emergency treatment and removal are arranged; do not substitute it for calcium, shifting treatment or urgent dialysis. Consider bowel function, sodium-related edema and separation from interacting oral medications.
Why SPS is a poor emergency choice
Sodium polystyrene sulfonate (SPS; Kayexalate) has delayed and unpredictable potassium lowering, often taking hours to days, with limited evidence for rapid emergency benefit. Its labeling includes serious gastrointestinal injury, including ischemia, necrosis and perforation; sorbitol adds risk. It also supplies sodium and can affect other medications. It is not a dependable emergency bridge and should not be the reason to defer dialysis. This does not imply that every use of SPS is prohibited; it explains why it is a poor choice for this unstable case.
Dialysis starts a process, not an instantaneous result
Call the dialysis team early and establish whether usable access is already present. Staff mobilization, assessment, an access procedure when necessary, machine safety checks, dialyzer and circuit priming, and connection all precede clearance. Readiness can take tens of minutes to hours, depending on local resources; no universal machine-setup time is defensible. Ask for the actual estimated start time and escalate a delay that exceeds the patient's clinical tolerance. Potassium removal begins when treatment runs, not when the order is entered. Continue temporizing treatment and monitoring during preparation; check for post-dialysis rebound.
Still making urine? Look for a reversible drainage problem
Residual urine output makes a urinary contribution possible, but urine volume does not measure potassium clearance. If retention, a blocked catheter or obstructive AKI is plausible, assess bladder volume and catheter patency and decompress retention when indicated. A Foley can relieve lower-tract obstruction and measure output when those indications exist. It is not a universal first step and does not treat upper-tract obstruction by itself. Useful renal function and appropriate perfusion are still needed for potassium excretion; a loop diuretic may assist selected patients. Do not delay cardiac protection or urgent dialysis while waiting for a urinary response. After decompression, monitor for post-obstructive diuresis, volume loss and electrolyte changes.
Apply the parallel plan to Case 1
Mr. Hartman has a widened QRS, missed dialysis, pulmonary edema and insufficient potassium clearance despite residual urine. Protect the heart, shift potassium, call for urgent dialysis, and consider an appropriate gut binder while the team prepares. Assess retention if the history, examination or low output suggests it. An early potassium fall after insulin does not remove the body load or resolve pulmonary edema. State when each treatment started, when its effect may fade, and when the next potassium, ECG and glucose assessment is due.
Learn first: Interpret the response by its mechanism
Ask whether the treatment moved potassium into cells or removed it from the body. A temporary fall after insulin does not resolve the original potassium load, eliminate rebound risk or treat pulmonary edema.
Learn first: Protect present and future dialysis access
An arteriovenous fistula is a surgically created artery-to-vein connection for repeated dialysis access. Avoid routine IVs, blood draws and blood-pressure cuffs on the functioning access arm. Preserve veins and involve the access team when alternatives are difficult.
Use this visual teaching sequence before the first question. Return to the relevant framework as new findings appear; commit to your interpretation before opening the answer.
1. Approach
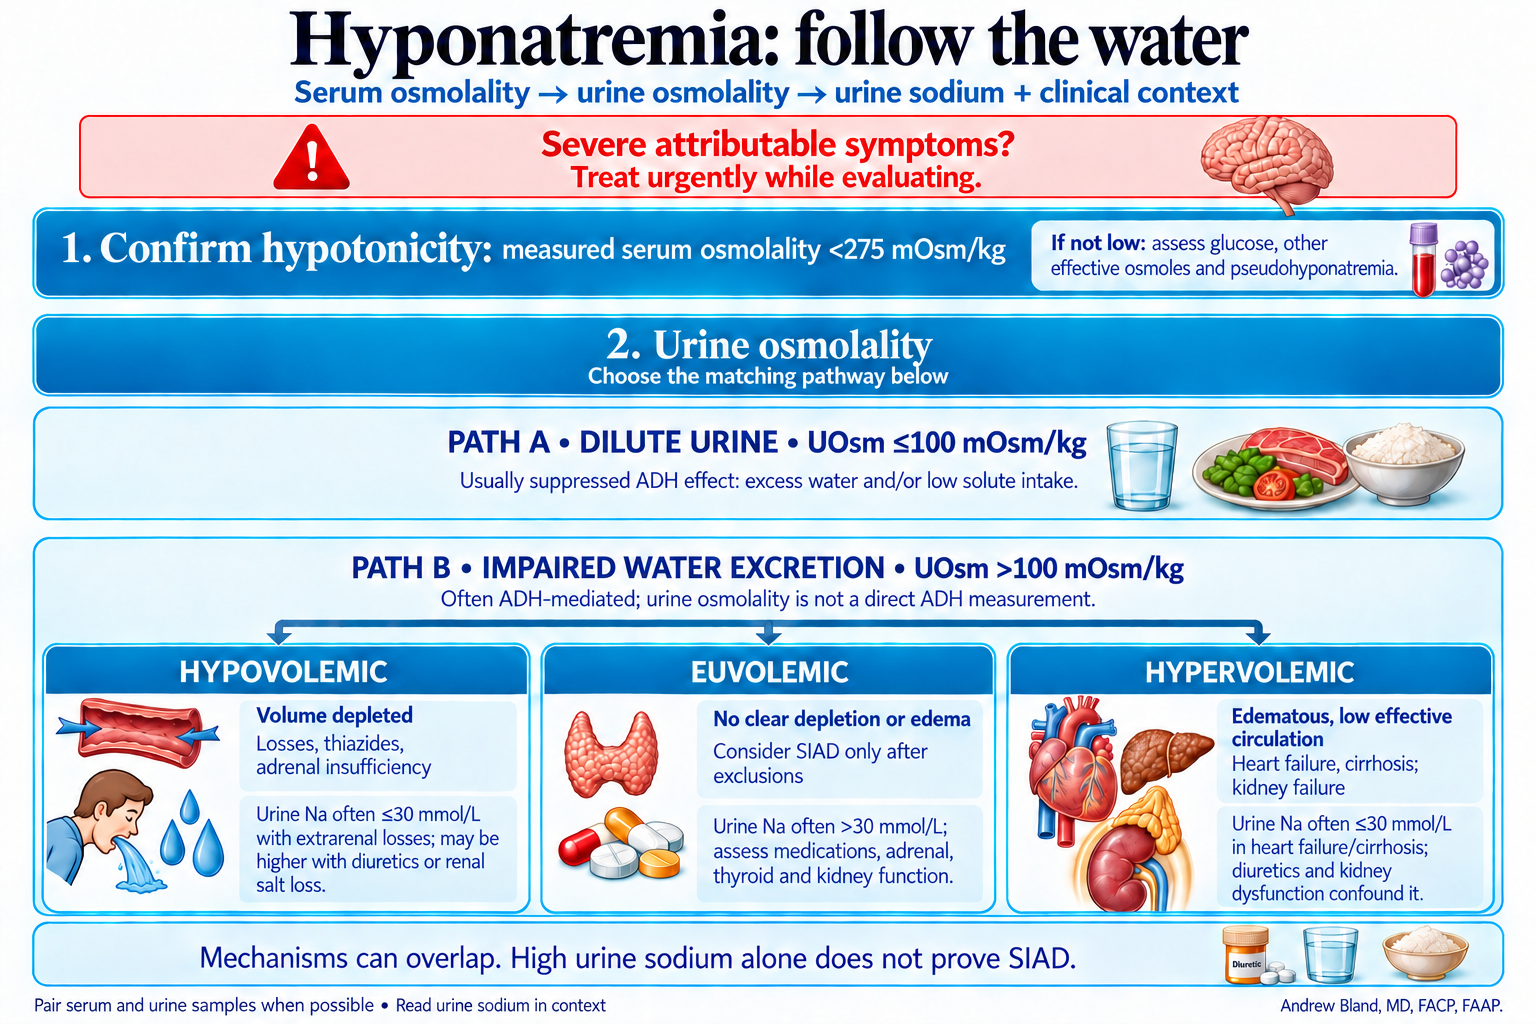
Confirm tonicity, assess urine dilution, then use volume status and urine sodium in context.
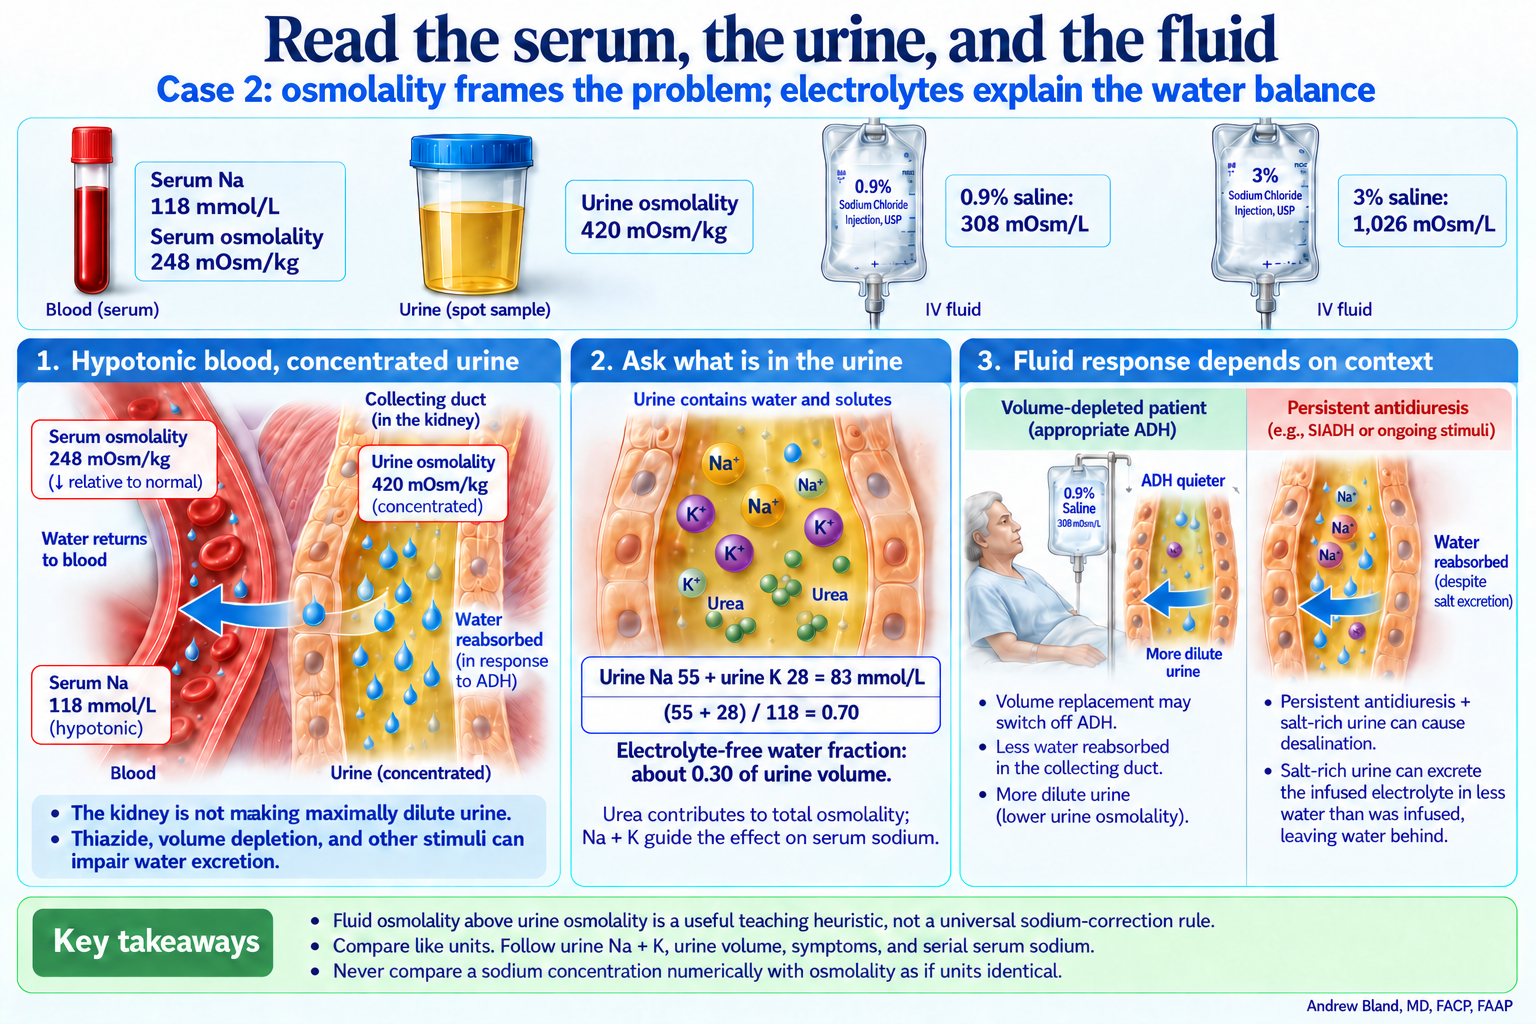
After confirming hypotonicity, ask whether the urine is appropriately dilute. A concentrated urine can reflect ADH driven by low effective circulating volume or other stimuli; SIAD requires exclusions. Very dilute urine points toward high water intake or limited solute availability. Combine the urine pattern with medications and the whole volume assessment.
Urine osmolality describes how dilute or concentrated the urine is. During hypotonicity, an intact kidney normally suppresses ADH and excretes dilute urine. A value above about 100 mOsm/kg suggests impaired dilution, but is not a direct ADH measurement or a diagnosis of SIAD.
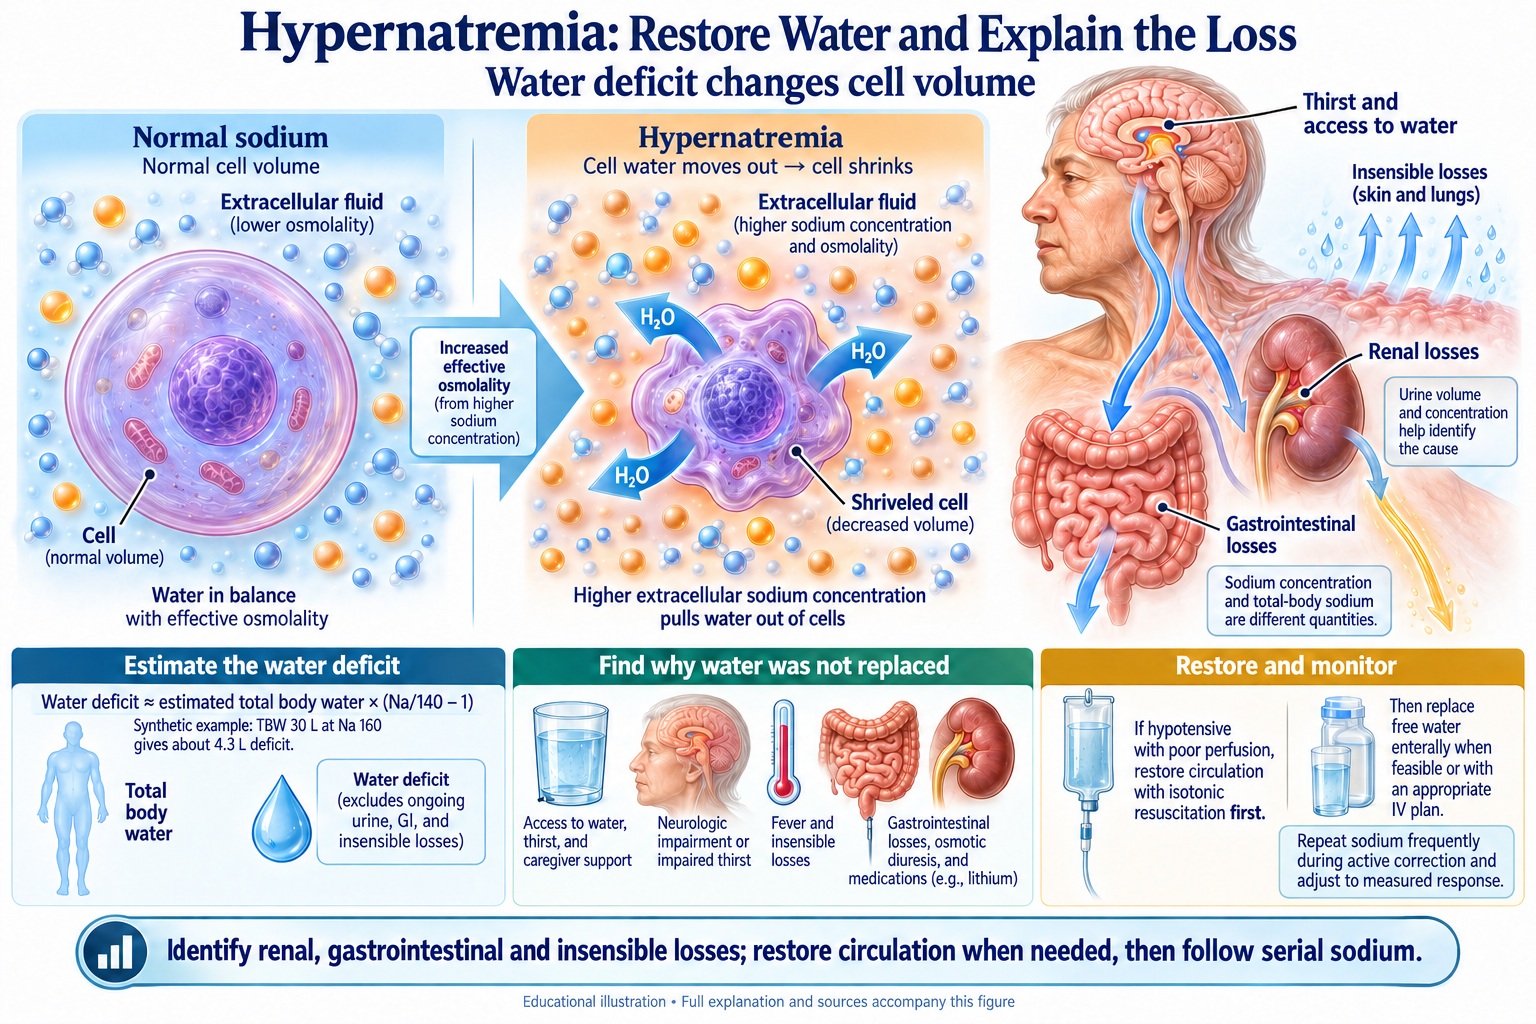
Learn first: Reverse the question in hypernatremia
Hypernatremia usually means too little water relative to body solute. A concentrated urine shows that the kidney is conserving water; a dilute urine suggests impaired concentration. Estimate the water deficit as total body water × (serum sodium/140 − 1), then account for ongoing losses and the patient's circulation.
Orthostatic symptoms, weight loss, low neck veins and dry mucosa can support volume depletion. Interpret them together, especially in an older adult. Edema and total-body fluid excess do not always mean adequate effective circulating volume.
Follow the original lecture lanes: tonicity, urine dilution, then volume and urine sodium.
Confirm tonicity and identify urgent symptoms
Measured serum osmolality below 275 mOsm/kg confirms hypotonic hyponatremia. If it is not low, assess glucose, other osmoles and possible laboratory artifact; normal measured osmolality does not automatically prove pseudohyponatremia. Urea contributes to measured osmolality but little to effective tonicity. Obtain paired serum and urine samples when practical without delaying urgent care.
Choose the urine-osmolality pathway
Urine osmolality ≤100 mOsm/kg usually indicates appropriately suppressed ADH effect; consider excess water intake and low solute availability. Above 100, water excretion is impaired: follow the three volume lanes below. Urine osmolality is not a direct ADH assay, and thiazides or kidney dysfunction can impair dilution.
Hypovolemic lane
Look for losses, poor intake, orthostasis and weight loss. Urine sodium ≤30 mmol/L supports sodium conservation from low effective circulation; higher values may reflect diuretics, renal salt loss or adrenal insufficiency. A thiazide can raise urine sodium despite depletion.
Euvolemic lane
Consider SIAD when there is no convincing depletion or edema, but review medications and exclude adrenal insufficiency, relevant thyroid disease and impaired kidney function. Urine sodium often exceeds 30 mmol/L with adequate intake; that result alone does not establish SIAD.
Hypervolemic lane
Heart failure and cirrhosis can combine edema with low effective arterial circulation and persistent ADH release. Urine sodium is often low, but diuretics and kidney dysfunction complicate interpretation. Advanced kidney failure can also limit water excretion.
Apply the lanes to Case 2
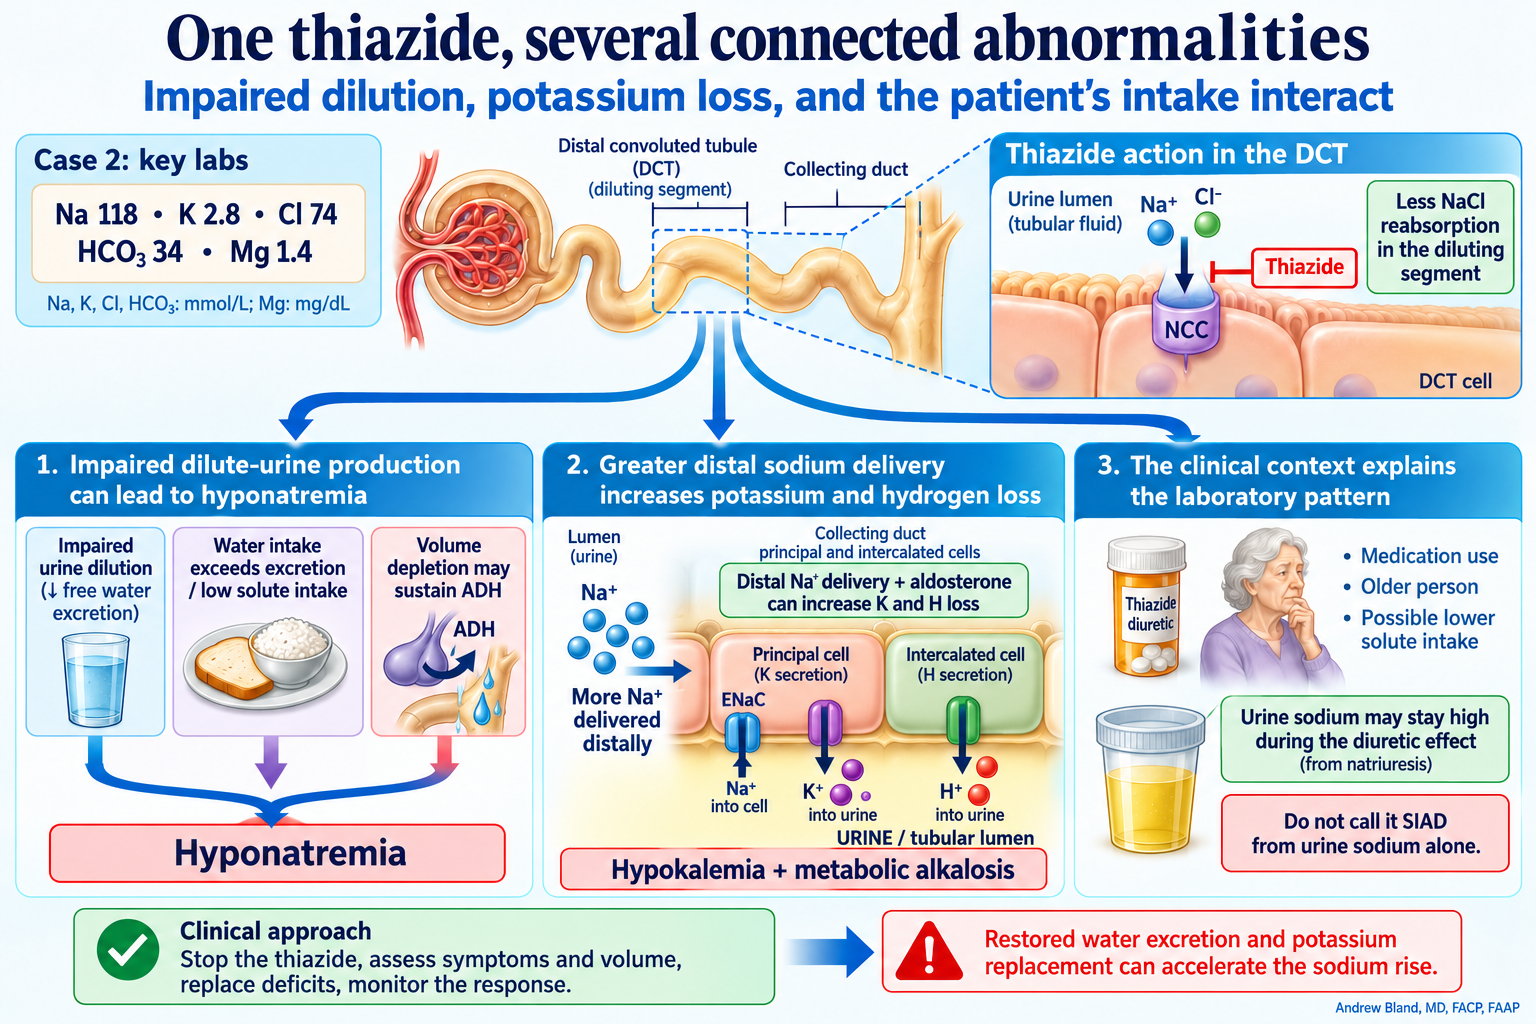
Serum sodium 118 mEq/L with measured osmolality 248 mOsm/kg establishes hypotonicity. Urine osmolality 420 mOsm/kg shows impaired dilution. Urine sodium 55 mmol/L during thiazide use does not erase the clinical evidence of depletion. Thiazide exposure, low intake, nausea and ADH-mediated water retention can coexist.
Thiazides inhibit sodium-chloride reabsorption in a diluting segment. Impaired dilution, low solute intake, excess water intake and volume-driven ADH can combine. A high urine sodium during the drug effect does not establish normal volume or prove SIAD.
Learn first: Read potassium, magnesium and bicarbonate together
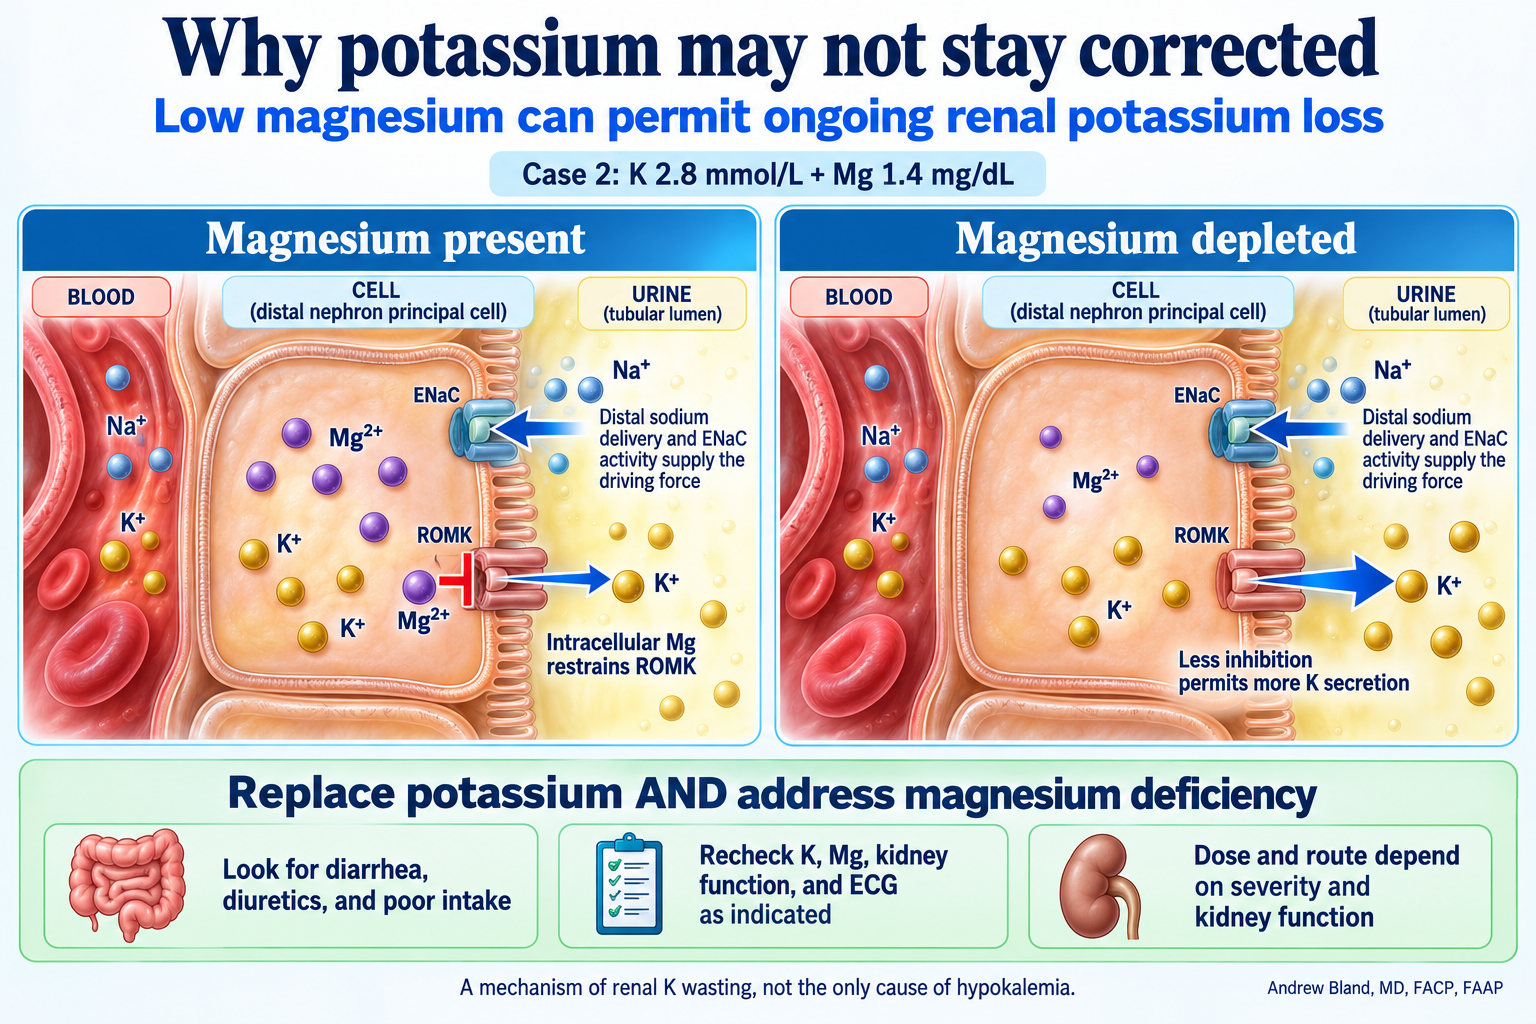
Diuretics can promote potassium and hydrogen loss, producing hypokalemia and metabolic alkalosis. Low magnesium can perpetuate renal potassium loss, so address both deficits. Urine chloride helps classify alkalosis, but recent diuretics can raise it despite volume and chloride depletion.
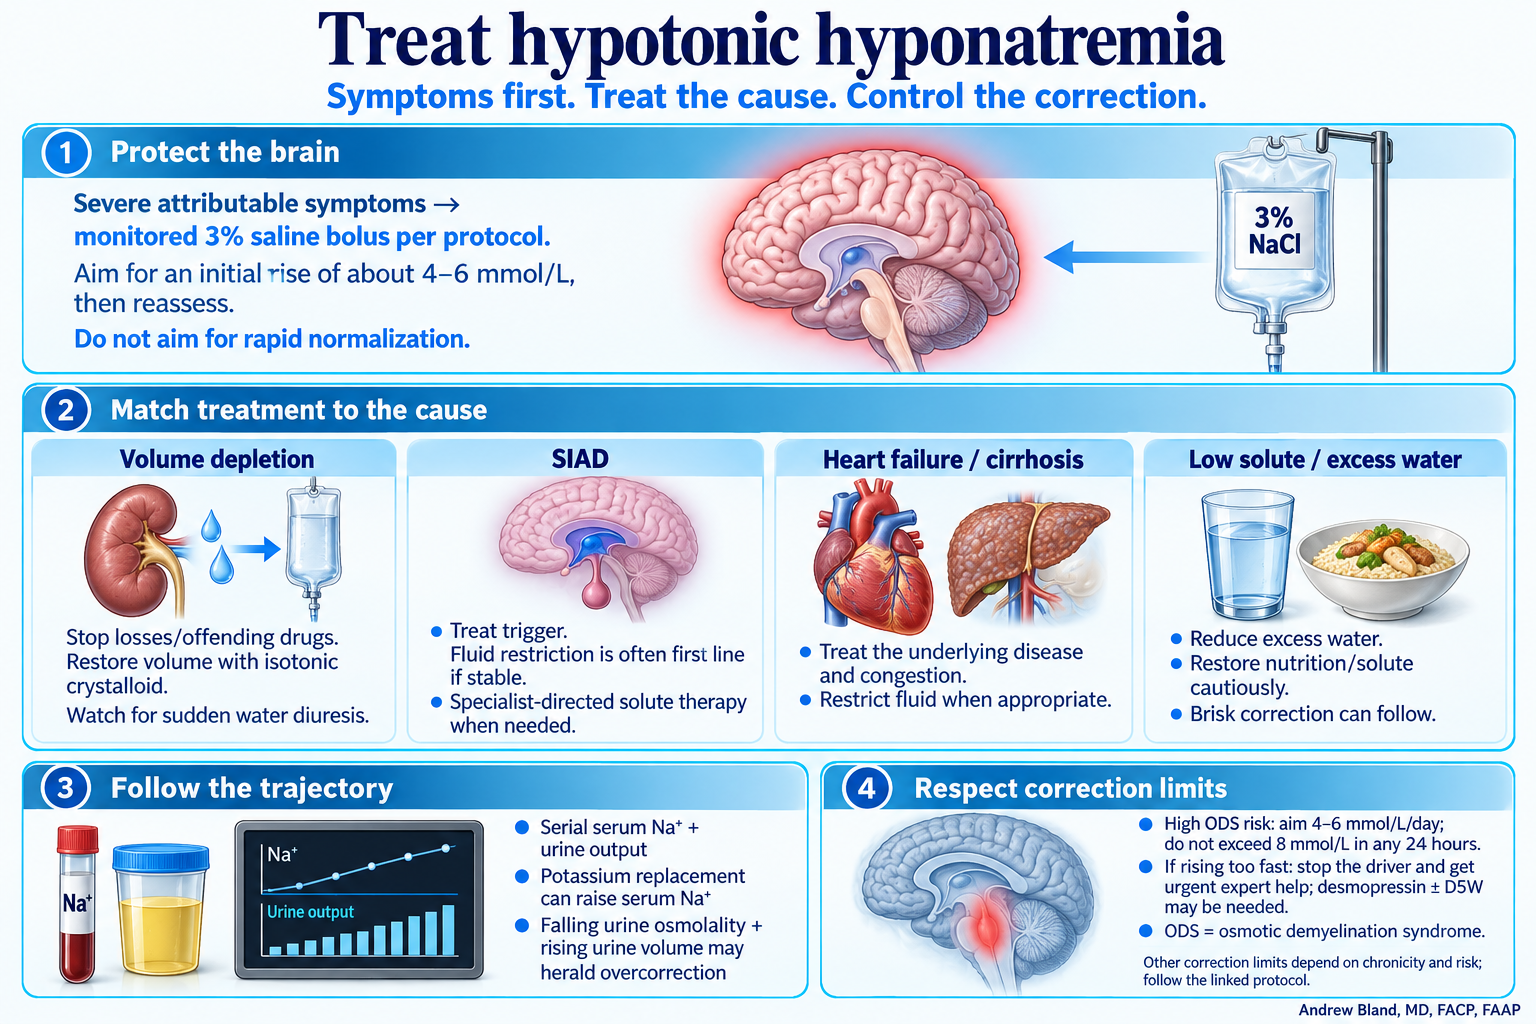
Symptoms first, cause-directed treatment, and control of the correction.
Protect the brain, then reassess
Severe attributable symptoms such as seizure, coma or major neurologic deterioration call for monitored 3% saline boluses under the local protocol while evaluating the cause. An initial sodium rise of about 4–6 mmol/L often provides useful symptom relief; rapid normalization is not the goal. Moderately severe attributable symptoms also warrant urgent assessment and may justify a monitored bolus.
Follow the same diagnostic lanes
Hypovolemic: stop offending drugs and losses, replace volume with an appropriate isotonic crystalloid and reassess. Euvolemic/SIAD: treat the trigger; fluid restriction is often initial therapy when stable, with specialist-directed solute therapy when needed. Hypervolemic: address the underlying disease and congestion, with fluid restriction when appropriate. Dilute urine/low solute: reduce excess water and restore nutrition or solute cautiously. These categories can overlap.
Set a correction plan before treatment
For chronic or uncertain-duration disease at high risk of osmotic demyelination, aim for approximately 4–6 mmol/L over 24 hours and avoid exceeding 8 mmol/L in any 24 hours. Major risk factors include very low sodium, hypokalemia, malnutrition, alcohol use disorder and advanced liver disease. For other patients, the European guideline limits correction to 10 mmol/L in the first 24 hours and 8 mmol/L per 24 hours thereafter. Limits are ceilings, not targets; account for all treatment and spontaneous changes.
Monitor water output as well as serum sodium
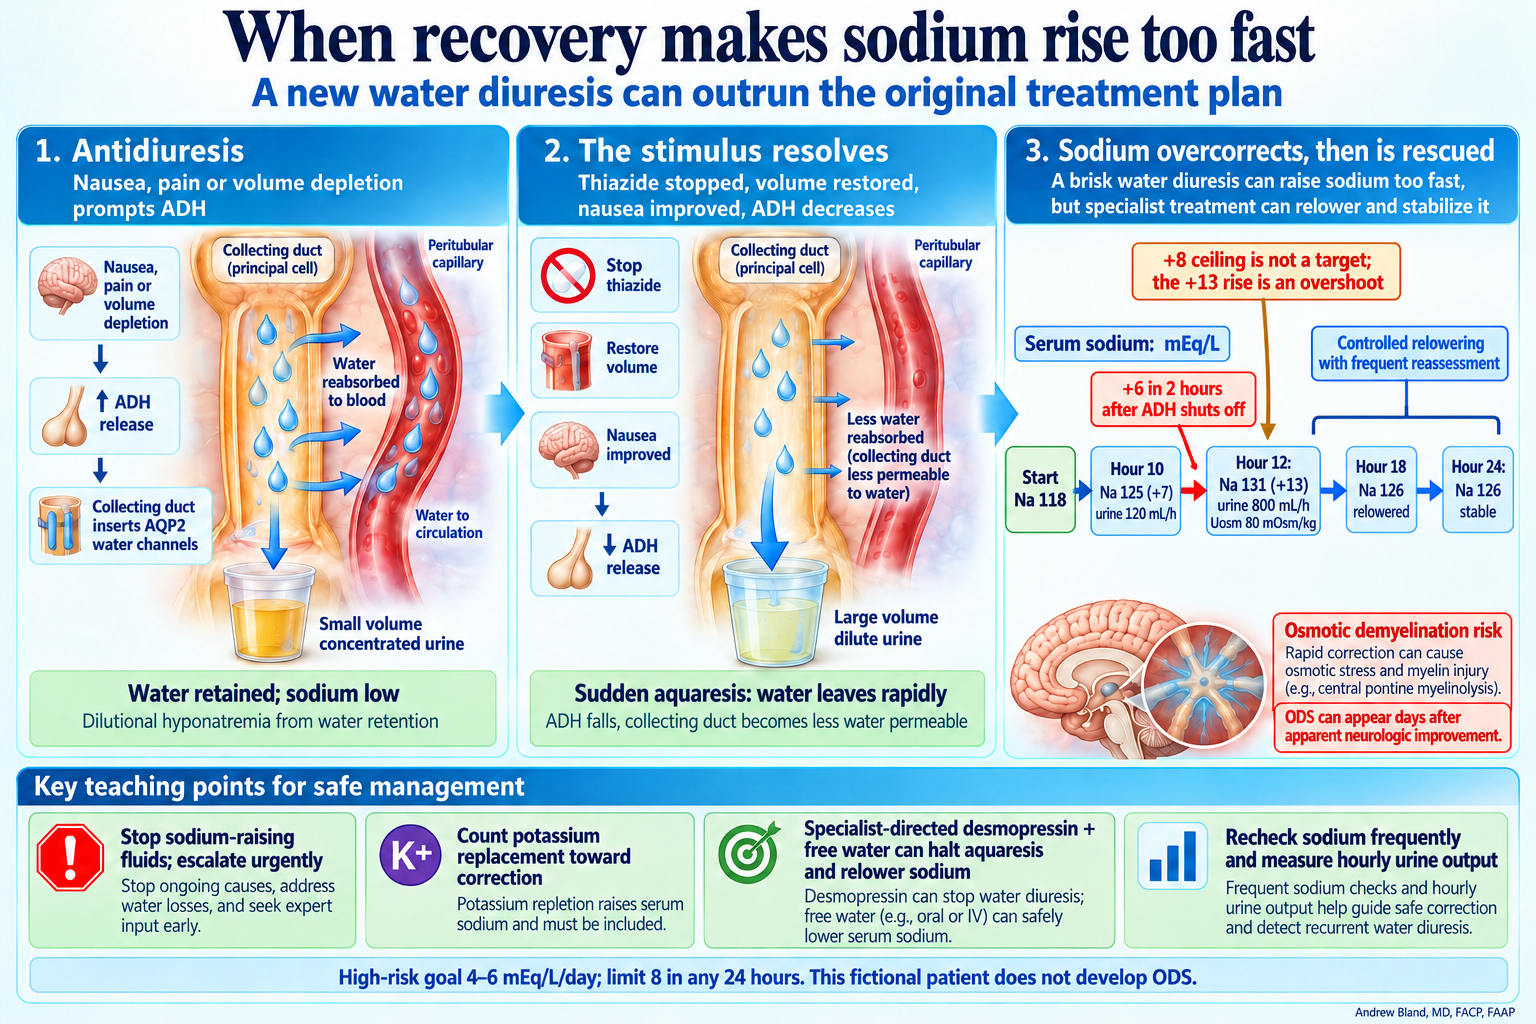
During active correction, follow serial sodium, urine output and clinical status frequently; monitoring intervals must shorten when the trajectory changes. Potassium replacement contributes to the rise in serum sodium. Volume restoration, thiazide withdrawal or solute replacement may suddenly permit a dilute water diuresis. If correction is running ahead of plan, stop the driver and obtain urgent expert help; desmopressin and electrolyte-free water such as D5W may be needed for controlled relowering.
Learn first: A urine result changes meaning on a diuretic
Urine sodium reflects current renal sodium handling, which a thiazide directly changes. Read serum and urine osmolality alongside urine Na + K and urine flow. Total urine osmolality includes urea and is not interchangeable with sodium concentration.
Learn first: Teach the correction limit before applying it
A brain adapted to sustained hypotonicity is vulnerable to osmotic demyelination if tonicity rises too fast. For this higher-risk setting, aim for a modest rise around 4–6 mEq/L and avoid more than 8 in any 24 hours; the ceiling is not a target. Potassium replacement and a new dilute water diuresis can accelerate the rise, even after saline stops. Follow both serial sodium and urine output, and escalate early.
After severe thiazide-associated hyponatremia, switching to another thiazide or simply reducing its dose does not reliably remove susceptibility. Choose an alternative blood-pressure strategy, check standing BP and arrange early laboratory follow-up when the new medicine affects electrolytes or kidney function.
The maximum water volume the kidney can excrete depends on the daily solute load divided by achievable urine osmolality. A very low protein and salt intake can limit water clearance even when ADH is suppressed and urine is dilute. Restoring solute can release a brisk diuresis.
Overcorrection timeline and rescue teaching — includes the later case outcome
When recovery makes sodium rise too fast
Escalate urgently to a monitored setting and nephrology; stop sodium-raising infusions and reassess all inputs, including potassium replacement. Specialist-directed desmopressin halts aquaresis and titrated free water permits controlled relowering, guided by frequent sodium checks and hourly urine output. In the fictional course, sodium returns to 126 by hour 18 and stays there through hour 24; no ODS develops. Rescue does not establish that the preceding overshoot was safe.
Use this visual teaching sequence before the first question. Return to the relevant framework as new findings appear; commit to your interpretation before opening the answer.
1. Approach
Use the skeleton key: blood, urine and patient. Read the BMP and acid-base pattern in a fixed order.
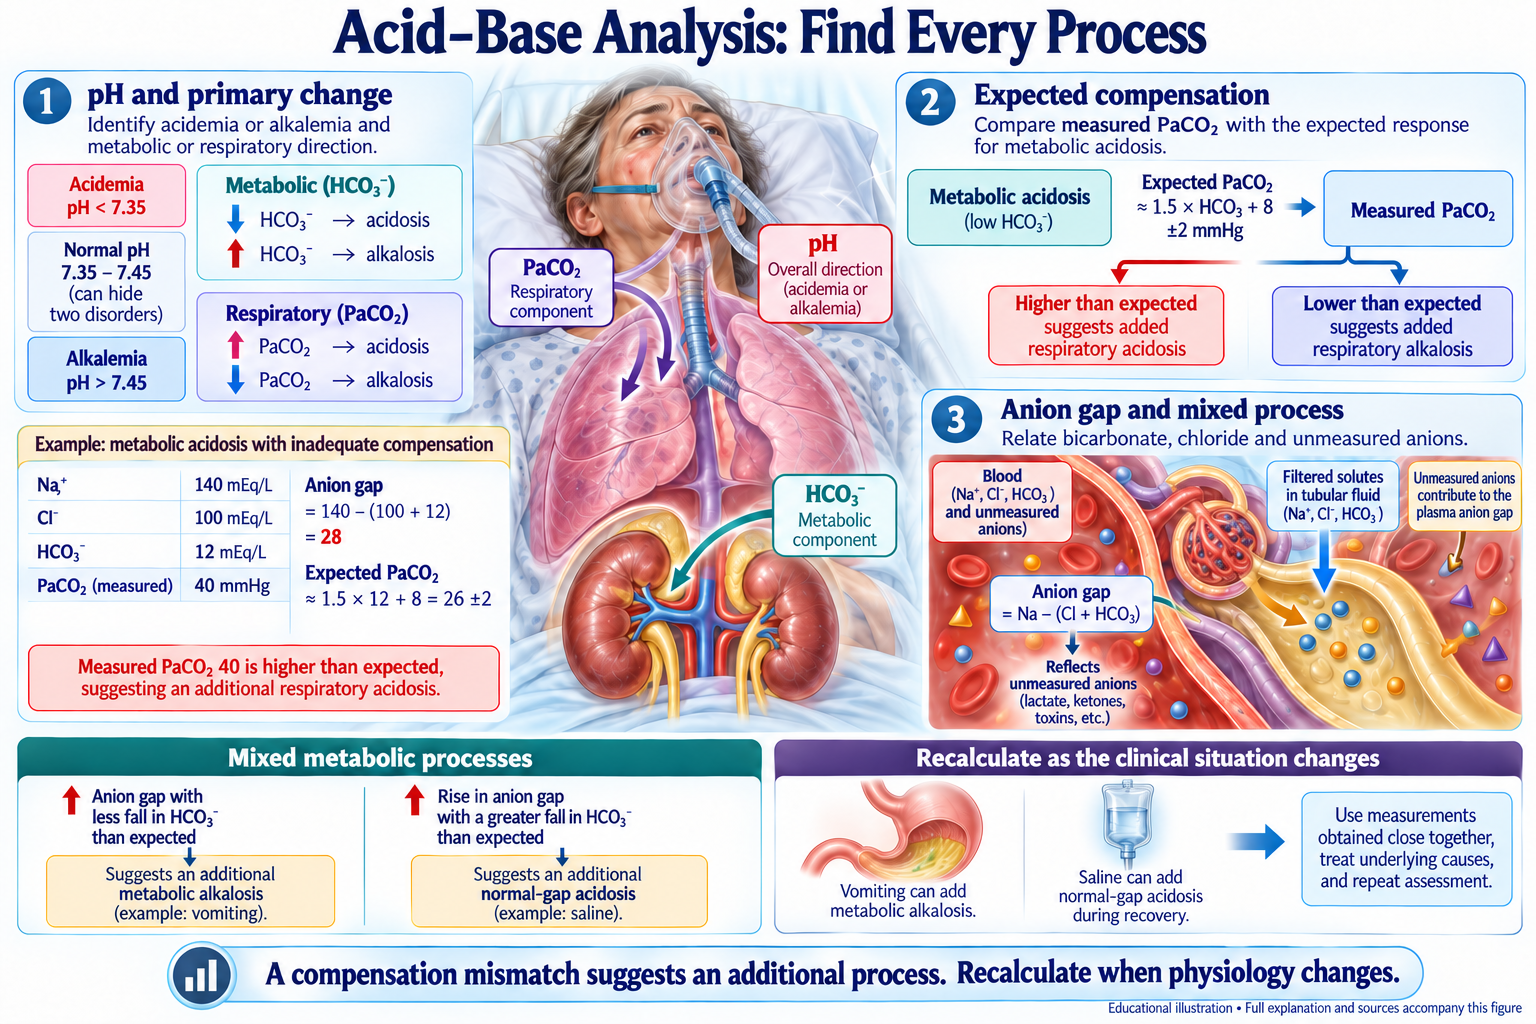
Learn first: Calculate the gap and account for albumin
The usual anion gap is sodium − (chloride + bicarbonate). Albumin is an important unmeasured anion, so low albumin can conceal an elevated gap; add about 2.5 mEq/L for each 1 g/dL that albumin is below 4. Use the laboratory's reference range.
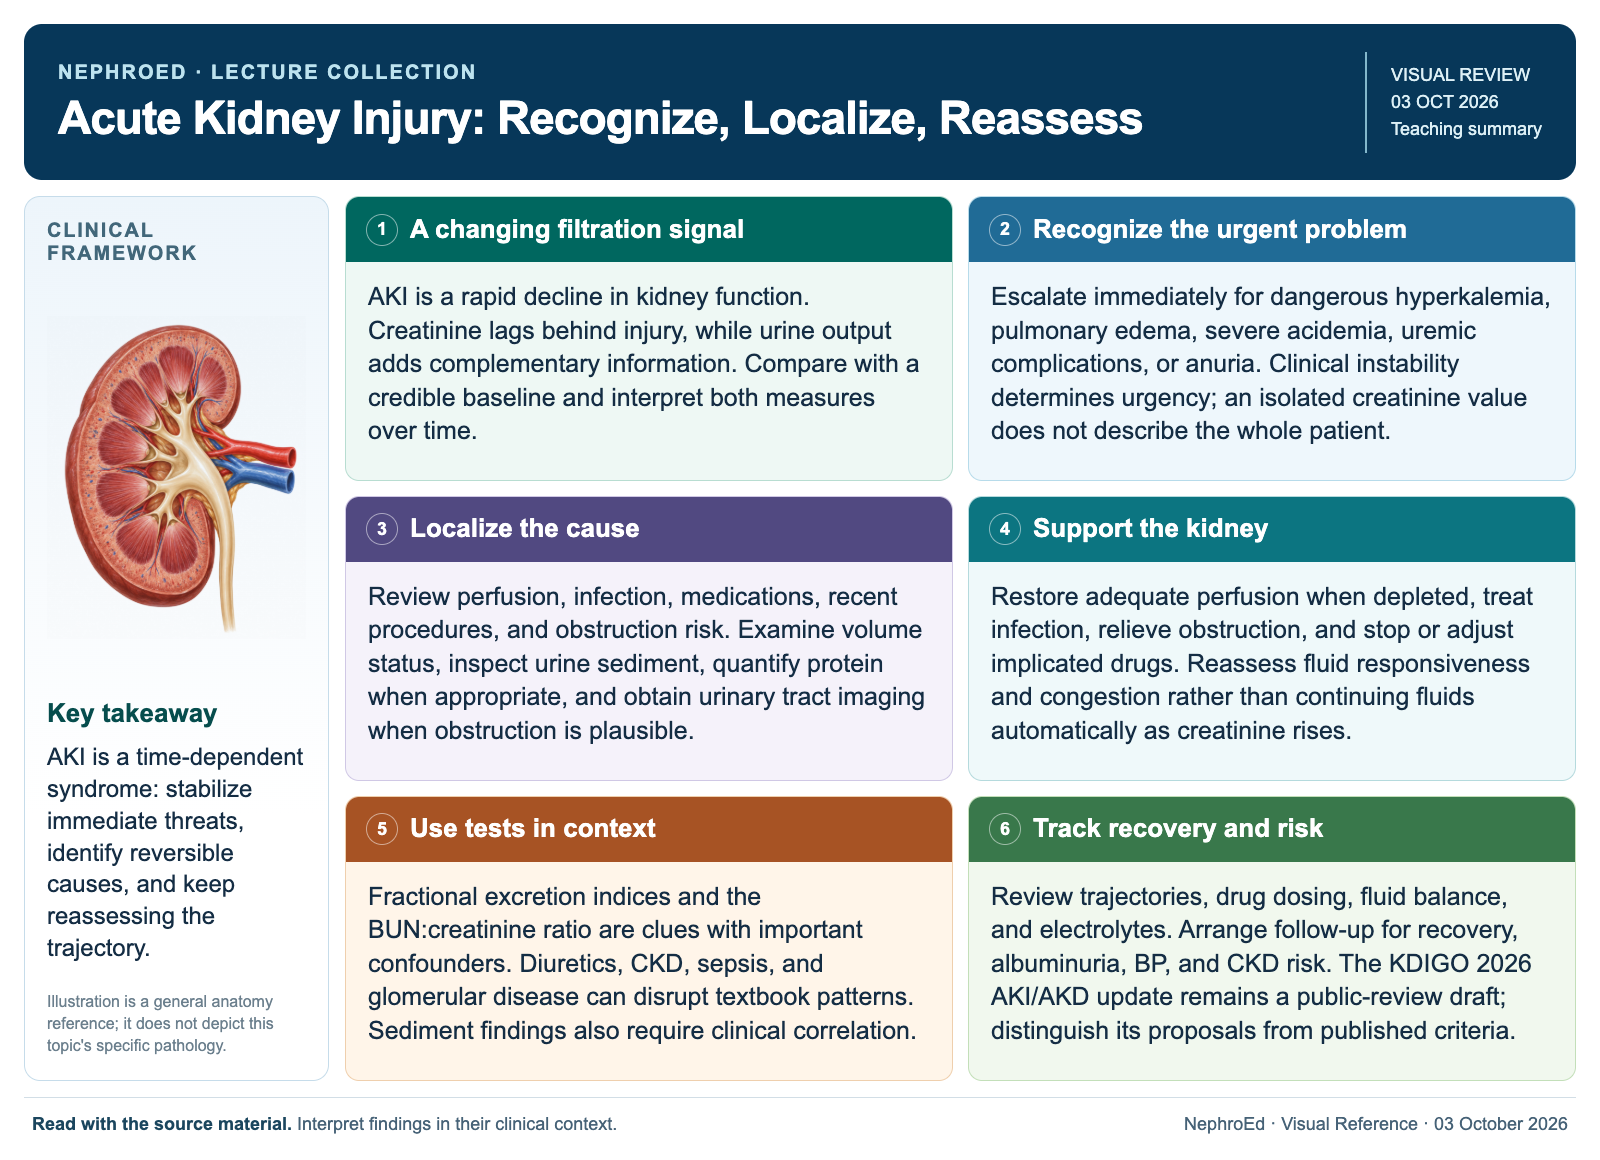
Compare creatinine with a recent baseline and assess urine output. KDIGO staging uses the magnitude and timing of the rise or the degree and duration of oliguria. An eGFR calculated while creatinine is changing is not a reliable measure of current filtration.
Vomiting, diarrhea and poor intake can make medicines that were safe yesterday unsafe today. Review volume depletion, kidney function and each drug's mechanism; consider the case's sick-day holds and give clear review and restart instructions. Do not apply a mnemonic without clinical context.
An SGLT2 inhibitor promotes glucose loss in urine. During illness and reduced intake, ketone production can continue despite a modest blood glucose. Test the suspected acidosis and ketone burden rather than using glucose alone to dismiss DKA.
Learn first: Name each component of the acid-base disorder
Read pH, bicarbonate and PCO₂; calculate the anion gap. In metabolic acidosis, compare PCO₂ with Winter's estimate, 1.5 × bicarbonate + 8 ± 2. Compare the rise in gap with the fall in bicarbonate to look for an additional metabolic process; vomiting can add alkalosis.
Blood beta-hydroxybutyrate directly measures the predominant ketoacid in DKA. A urine nitroprusside dipstick mainly detects acetoacetate and can underestimate early ketone burden. Integrate ketones with acidosis and the clinical setting; glucose alone does not settle the diagnosis.
Learn first: Connect the AKI stage to its mechanism
First localize the mechanism
Prerenal: reduced effective kidney perfusion from losses, low intake, hypotension or impaired circulation. Assess volume and hemodynamics; a fluid bolus is appropriate only when the findings support it.
Intrinsic: injury within the kidney—tubular, interstitial, glomerular or vascular. Medication exposures and urine microscopy help direct the workup.
Postrenal: obstruction. Assess bladder retention and obtain appropriate kidney imaging; a bland sediment does not rule it out.
These mechanisms can coexist or evolve. A low FeNa does not prove prerenal AKI, and diuretics, CKD and other settings limit its interpretation. Reassess creatinine, urine output, examination and response.
Read the cast, then test the clinical story and specimen quality.
Hyaline and muddy brown casts
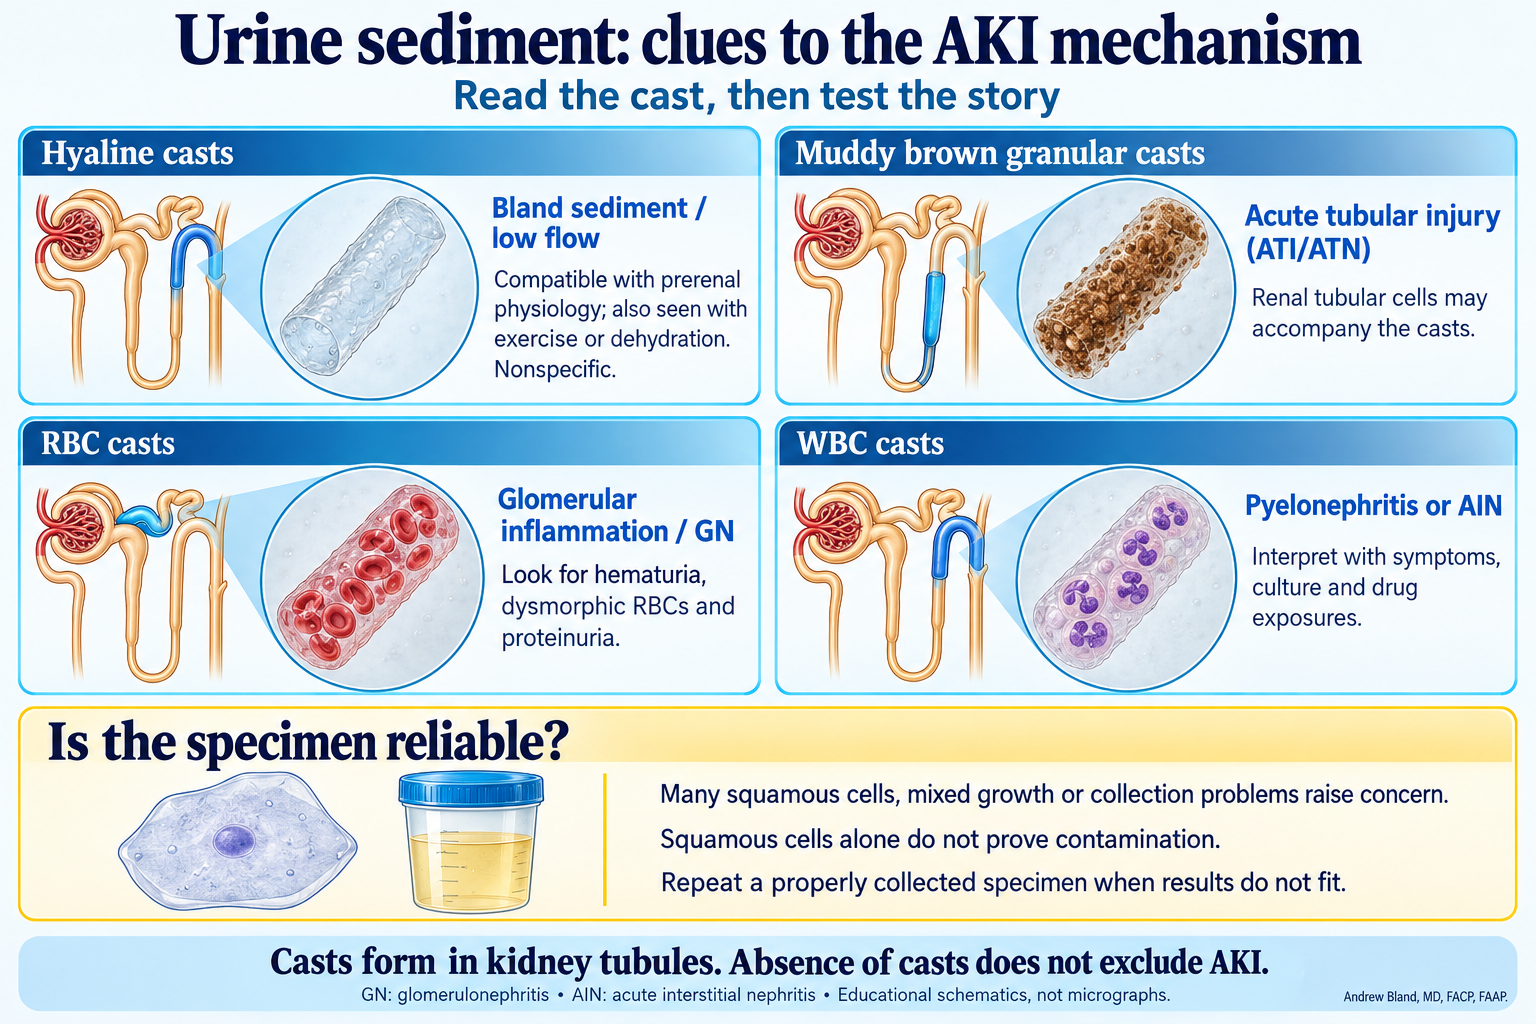
A bland sediment with occasional hyaline casts is compatible with low-flow or prerenal physiology. Hyaline casts are nonspecific and also occur with dehydration or exercise without AKI. Muddy brown granular casts and renal tubular epithelial cells strongly support acute tubular injury, often termed ATN in teaching; they do not identify its cause by themselves.
Red-cell and white-cell casts
RBC casts strongly suggest glomerular inflammation, especially with dysmorphic red cells and proteinuria, and warrant prompt evaluation. WBC casts suggest inflammation within the kidney, including pyelonephritis or acute interstitial nephritis. Fever, flank symptoms and culture support infection; medication timing and other findings may suggest AIN. Neither cast is perfectly sensitive or exclusive to one diagnosis.
Check specimen quality before interpreting infection
Numerous squamous epithelial cells, mixed organisms on culture, vaginal secretions or menstrual blood, poor collection, or delayed processing raise concern for contamination. Squamous cells alone do not prove it, and bacteriuria or pyuria alone does not establish symptomatic UTI. When results conflict with the presentation, repeat a fresh properly collected midstream sample; use catheter sampling when clinically indicated.
Know what contamination does not explain
True cellular casts form within kidney tubules. Do not dismiss RBC or WBC casts as lower-tract contamination simply because squamous cells are also present. Absence of casts does not exclude intrinsic disease, and a bland urinalysis does not exclude obstruction.
Learn first: Insulin can uncover a potassium deficit
Total-body potassium can be depleted by poor intake and urinary losses. Insulin moves potassium into cells and may lower the serum concentration rapidly. In DKA with potassium below 3.5 mmol/L, delay insulin and replace potassium under a monitored protocol until it is above 3.5; dextrose supports continued insulin when glucose is modest.
Learn first: The next fluid can change the acid-base pattern
Large chloride-rich saline loads can produce a normal-gap metabolic acidosis during DKA recovery. Balanced crystalloids reduce the chloride burden. Continue to address volume, potassium and the need for dextrose while insulin clears ketones.
Learn first: A low bicarbonate after DKA has several explanations
Use blood ketones and pH or bicarbonate to assess DKA resolution; anion gap alone can mislead. After chloride-rich fluids, a residual normal-gap acidosis can persist after ketones clear. The urine anion gap is only a contextual surrogate for ammonium and can be confounded by unmeasured urinary ions.
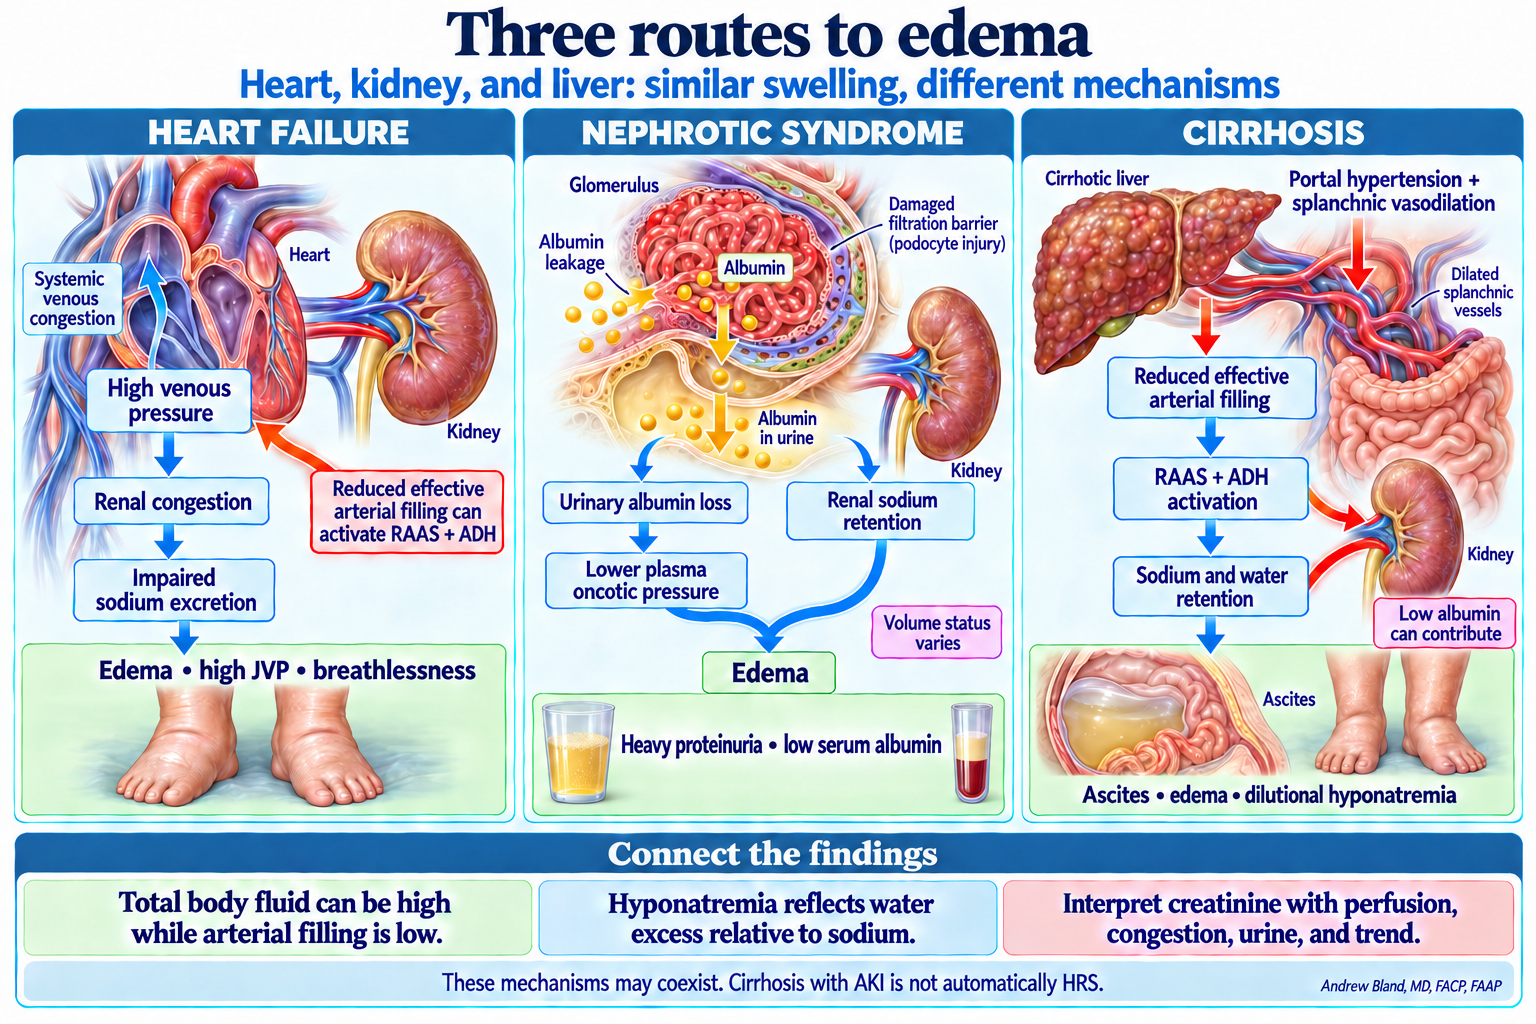
Why can a patient have swollen legs and still have poor effective arterial filling?
Interstitial fluid, venous congestion, and effective arterial filling describe different compartments and pressures. Decide which mechanisms are present using the examination, urine, laboratory trends, and response to treatment.
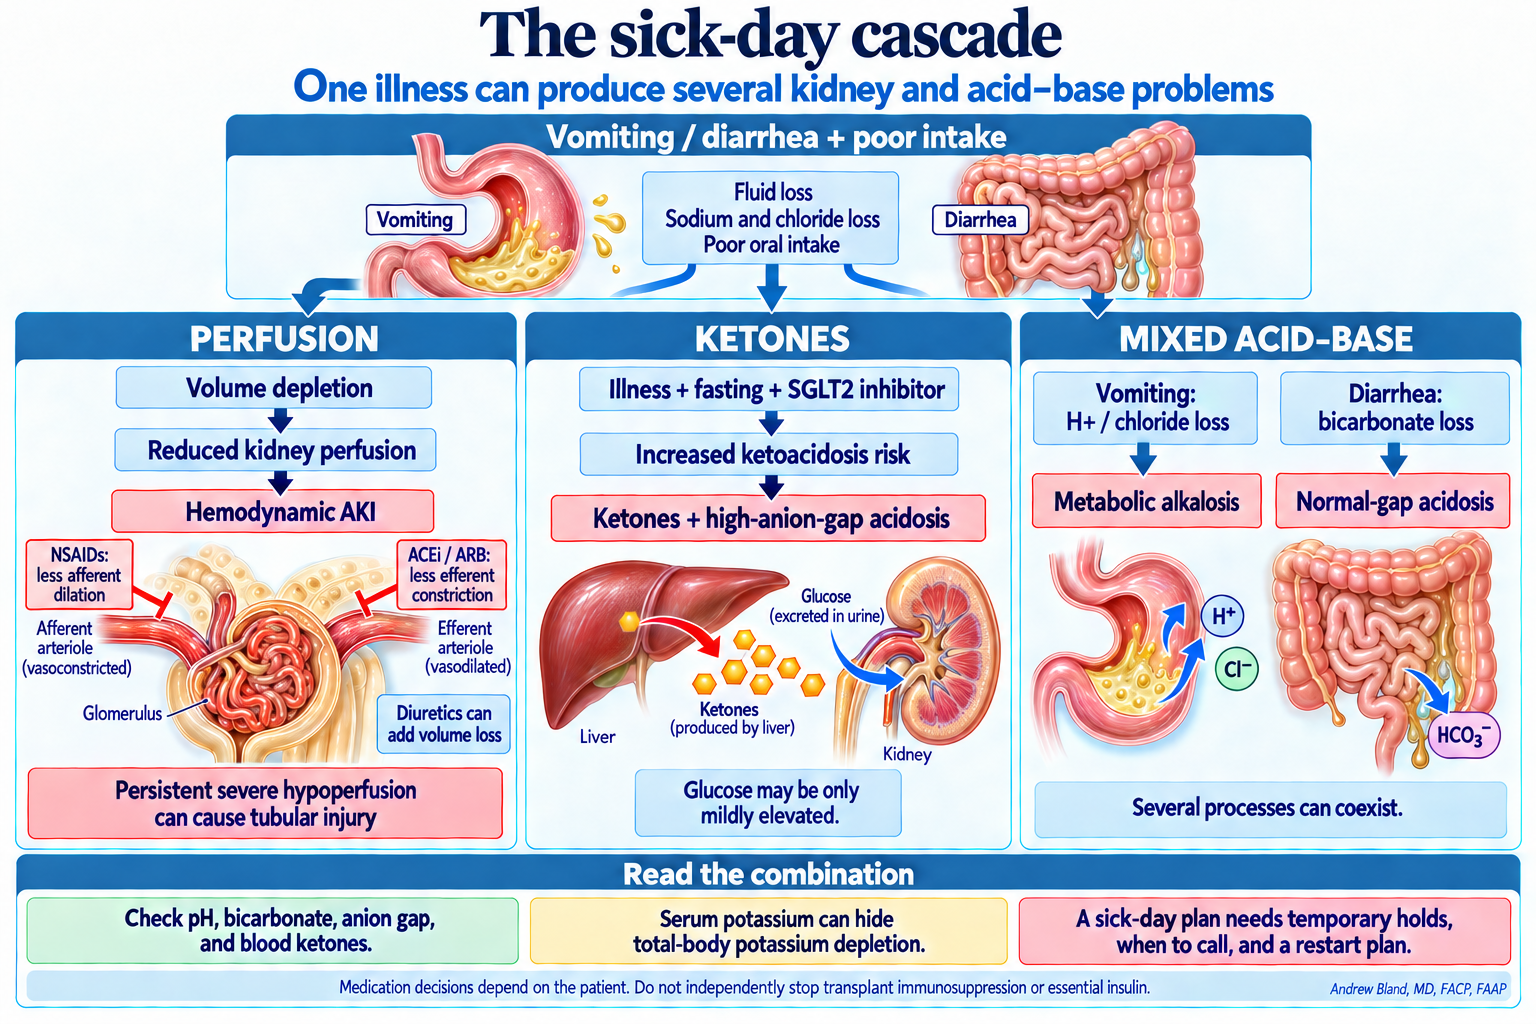
The sick-day cascade
One illness can produce several kidney and acid–base problems
Can a near-normal pH or a mildly elevated glucose exclude a serious sick-day problem?
No. Mixed acid–base processes can partly offset one another, and SGLT2-associated ketoacidosis may occur without marked hyperglycemia. Review the full pattern, ketones, volume status, medication timing, and kidney-function trend.
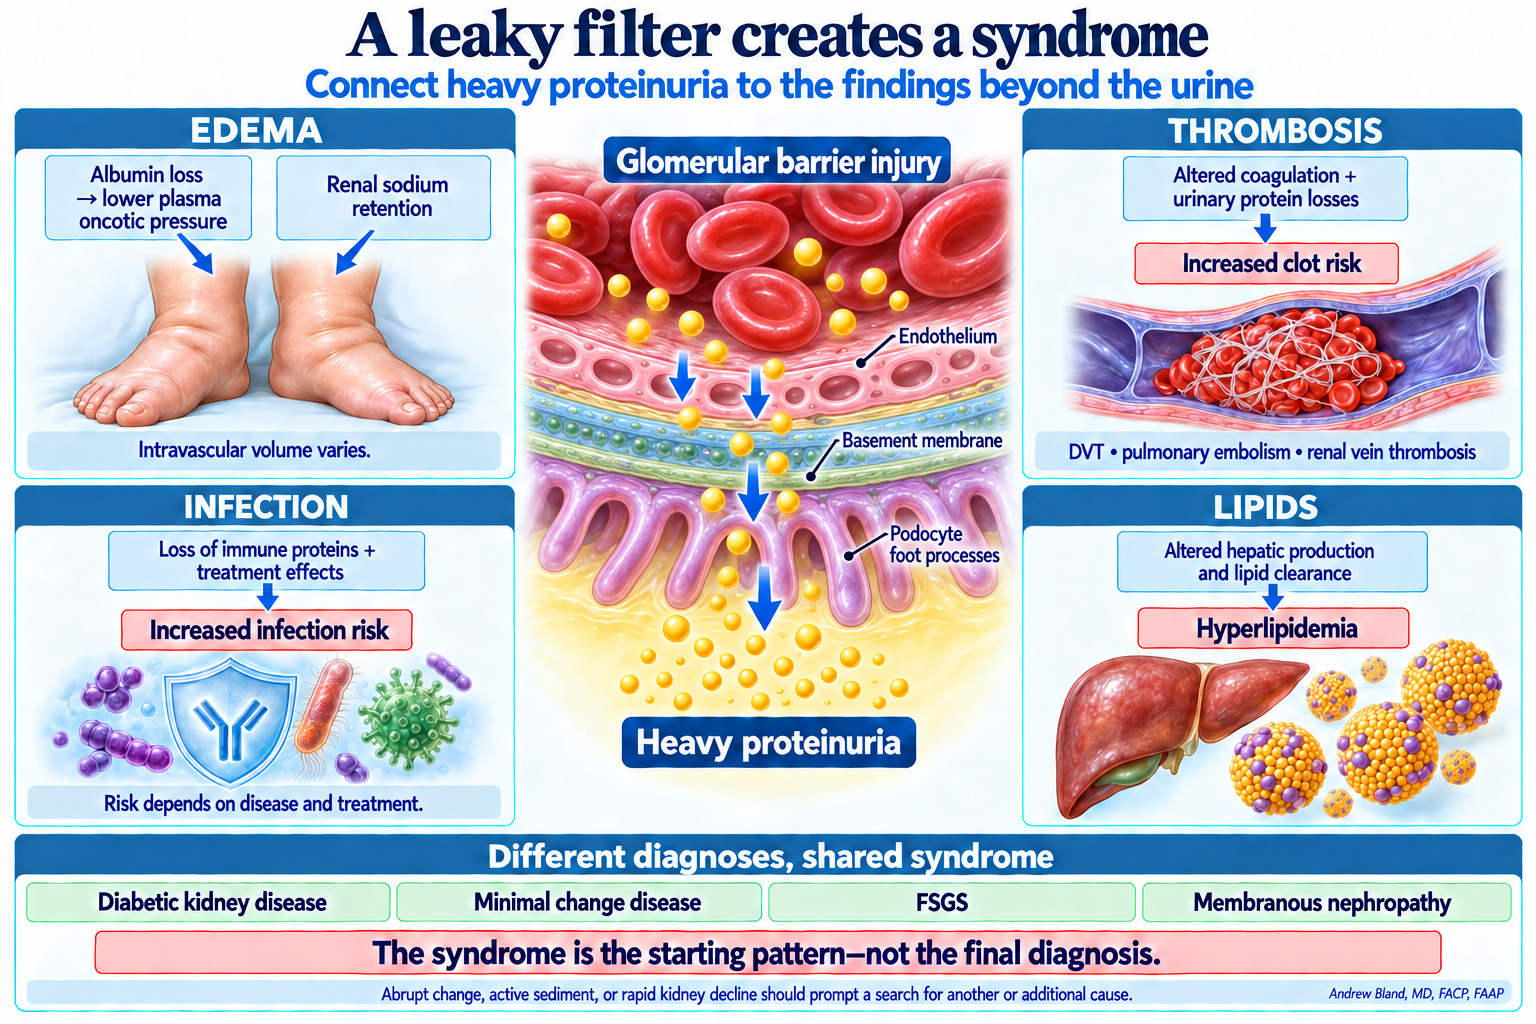
A leaky filter creates a syndrome
Connect heavy proteinuria to the findings beyond the urine
When a nephrotic patient develops new flank pain or a sudden creatinine rise, is progression of the original disease the only explanation?
No. Reassess for renal vein thrombosis, volume and hemodynamic changes, medication effects, infection, and other AKI causes. A new finding may be a complication superimposed on the original glomerular disease.
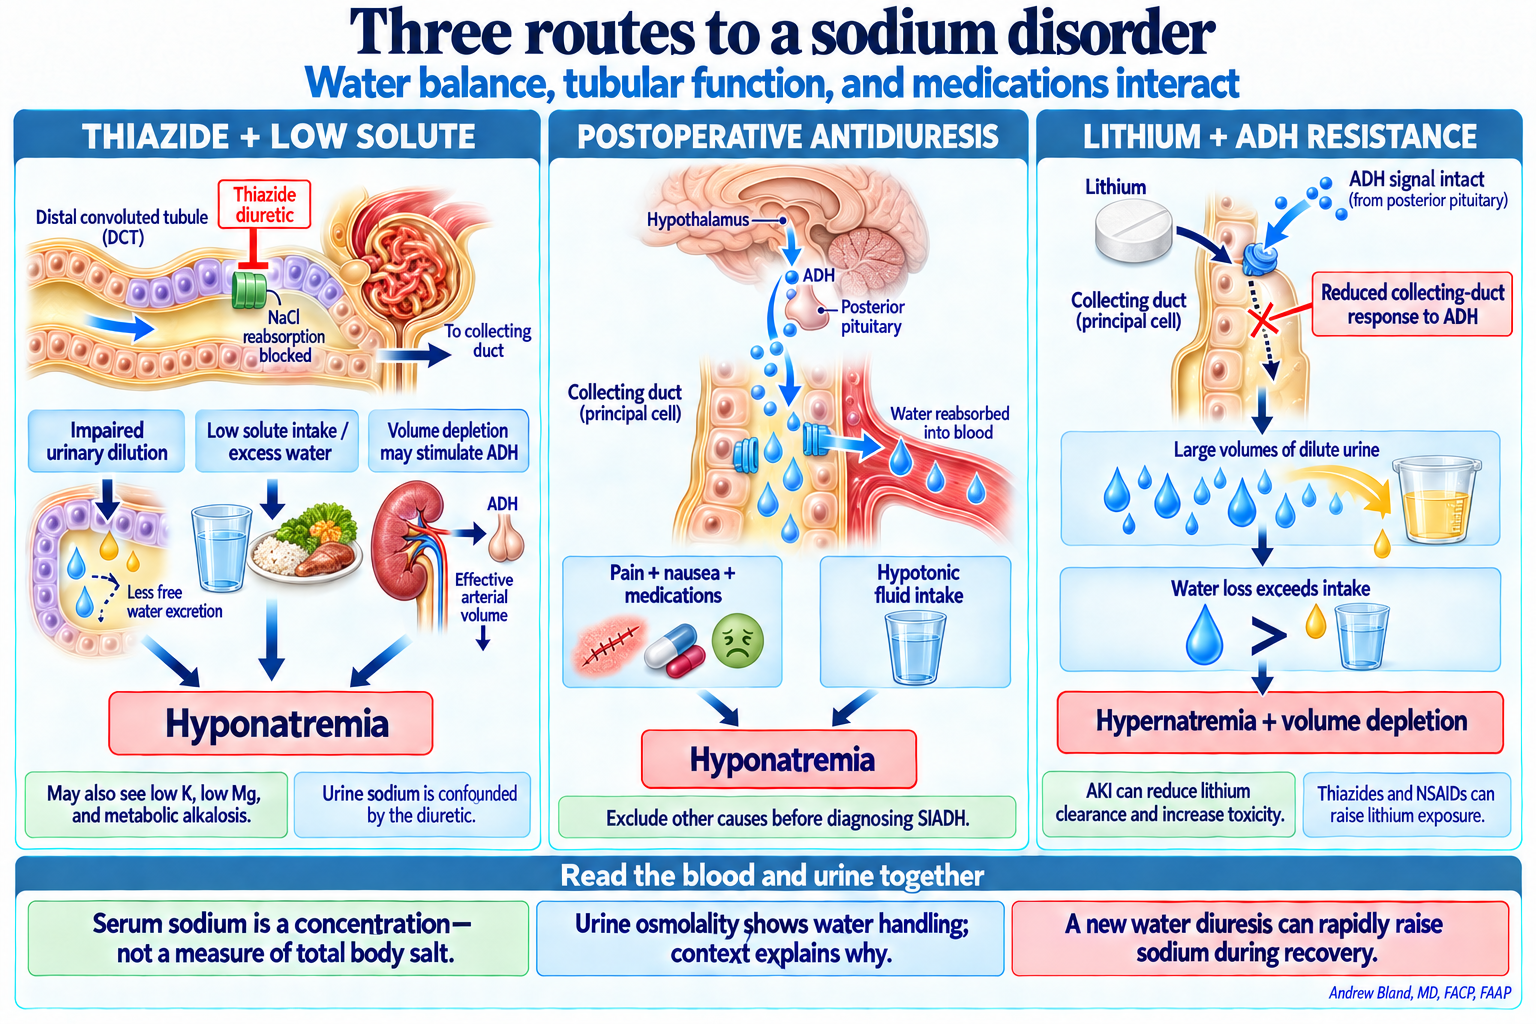
Three routes to a sodium disorder
Water balance, tubular function, and medications interact
Why does a high urine sodium not settle the diagnosis in the patient taking a thiazide?
The drug itself changes renal sodium handling. Interpret urine osmolality and electrolytes with volume status, dietary intake, medication timing, and the clinical course. Concentrated urine indicates impaired water excretion but does not identify one unique cause.
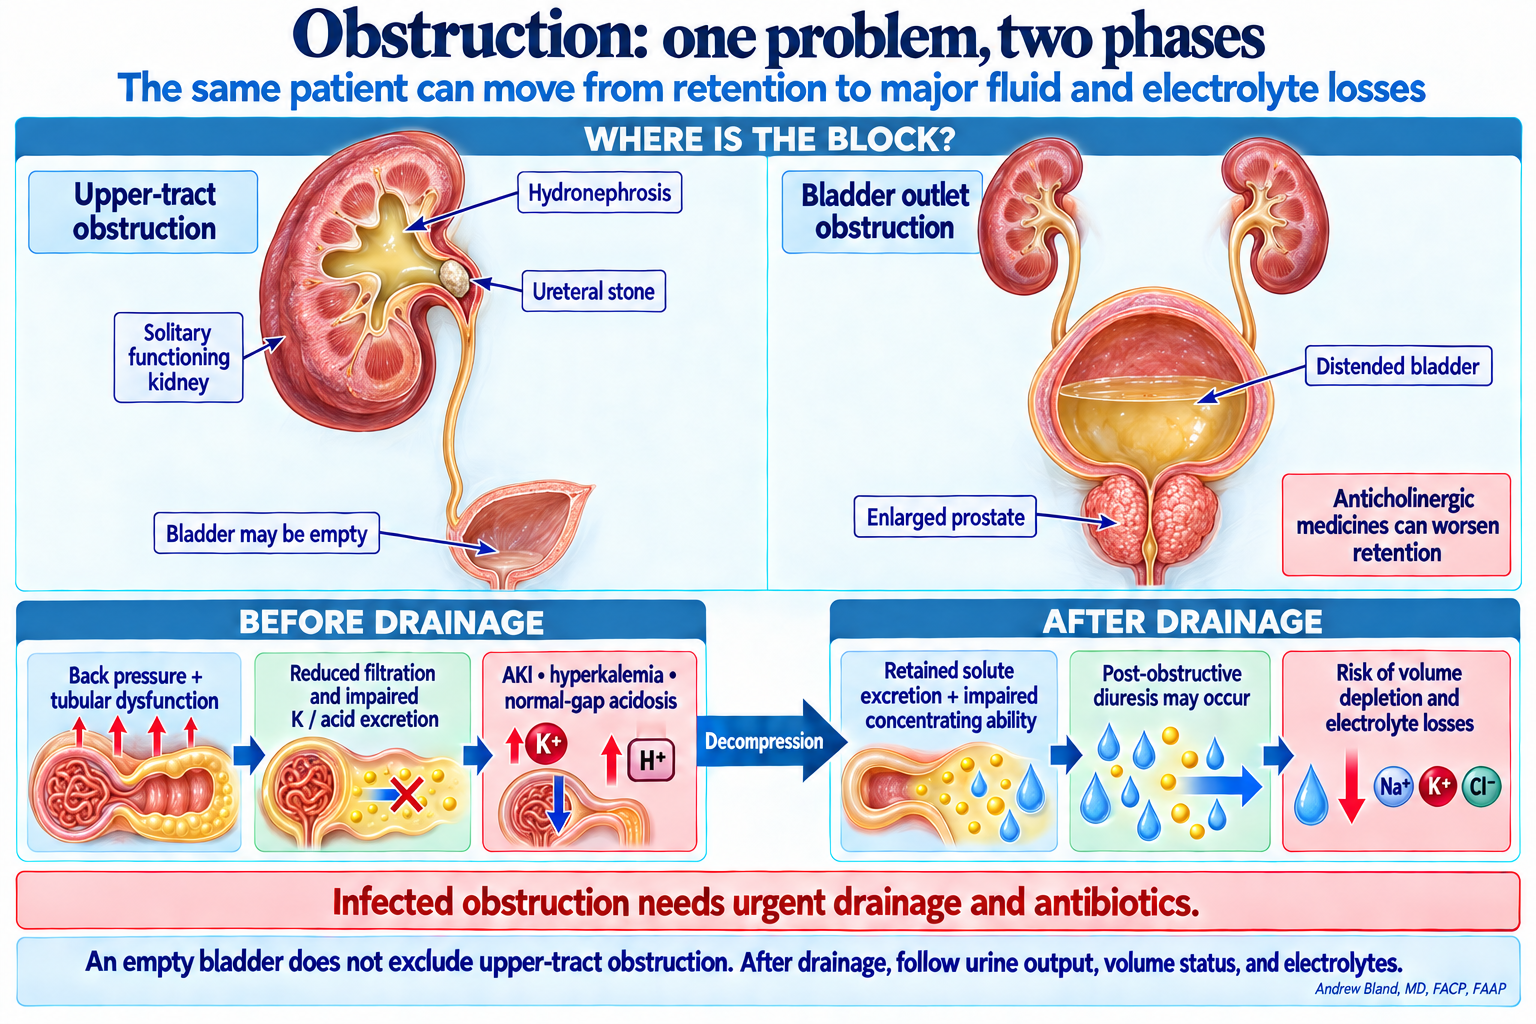
Obstruction: one problem, two phases
From impaired excretion to post-obstructive losses
Why can the treatment priorities reverse after the obstruction is relieved?
Before drainage, the kidney may retain potassium, acid, salt, and water. After drainage, excretion of retained solute plus incomplete recovery of tubular concentration can produce major water and electrolyte losses. Reassessment follows the phase of the illness.
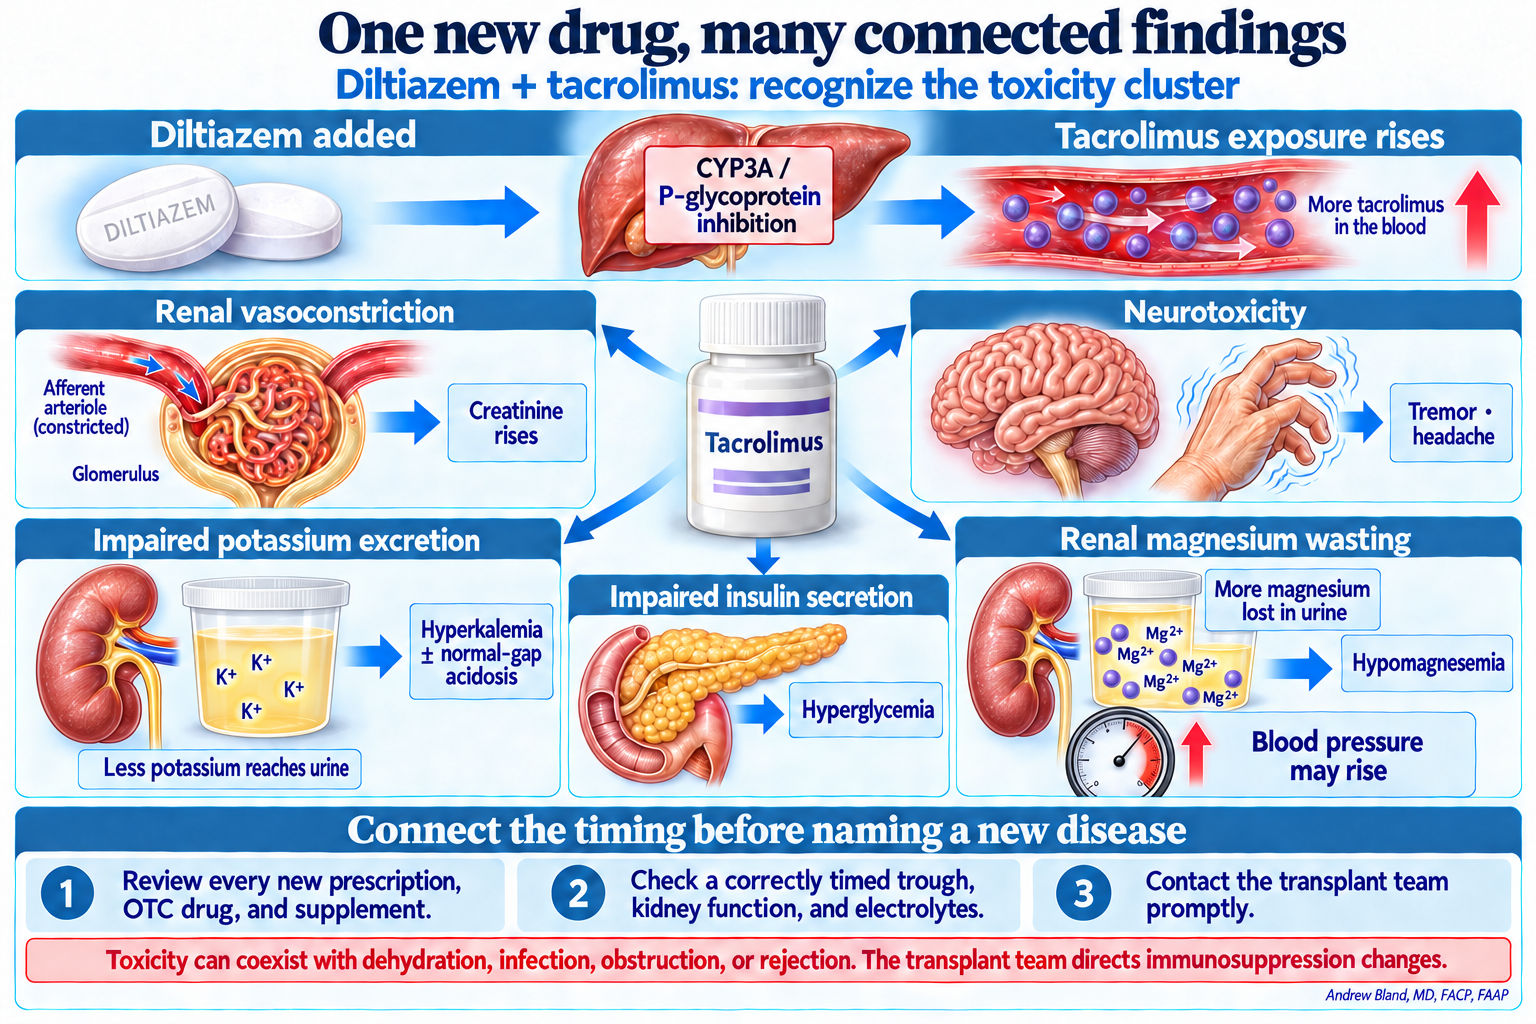
One new drug, many connected findings
Diltiazem plus tacrolimus: recognize the toxicity cluster
Does finding a high tacrolimus level exclude every other cause of a rising creatinine?
No. The interaction explains a plausible cluster, but transplant AKI still needs assessment for concurrent hemodynamic problems, infection, obstruction, and rejection as indicated.